
Abstract
Cercospora leaf spot (CLS), caused by the fungal pathogen Cercospora beticola, is considered one of the most destructive foliar diseases of sugar beet (Beta vulgaris). CLS causes leaf damage often followed by intensive foliage regrowth which can result in considerable sugar losses unless timely applications of fungicides are applied throughout the growing season. While progress is being made towards improving CLS resistance in commercially available varieties of sugar beet, disease-prone areas still require multiple applications of fungicides during the growing season to keep sugar beet crop losses to a minimum. Recently, the sugar beet germplasm KEMS06 (PI 683514) derived from an ethyl methanesulfonate (EMS)-mutagenized population was found to have high CLS resistance. Sibling cohorts of KEMS06 have shown diverse and tractable phenotypes suggesting that the CLS resistance trait from KEMS06 may contain genetic underpinnings that have not been leveraged before in commercially available sugar beet varieties. In this report, we describe the use of greenhouse CLS assays to characterize the CLS resistance trait from the KEMS06 sugar beet germplasm. Two different hybrid (resistant x susceptible) crosses were generated, and the disease resistance segregation patterns with corresponding variance scores in the successive filial generations were measured. The results presented in this report strongly suggest the CLS resistance trait in KEMS06 is directly linked to underlying genetic determinants that are segregating in-step across the population in a quantitative manner. Heritability of the KEMS06 CLS resistance trait was tractable into the F2, F3, and F4 filial generations. By following a single plant descent methodology—expedited by the use of self-fertility traits in the parental lines—complete introgression of the KEMS06 CLS resistance trait was observed in progeny families. In addition, the greenhouse methods described within this report accelerated our CLS resistance trait discovery and development pre-breeding timeline by reducing the time that would normally be required to introgress and fix disease resistance traits into new sugar beet germplasm by one to
Introduction
Cercospora leaf spot (CLS) caused by the fungal pathogen Cercospora beticola Sacc., is considered one of the most destructive foliar diseases of sugar beet (Beta vulgaris L.) and closely related relatives such as table beets, spinach, and swiss chard (Panella and Lewellen 2007; Vogel et al., 2018; Rangel et al., 2020; Tan et al., 2023). Moderate to severe epidemics causing extensive foliage damage and regrowth can result in considerable sugar losses unless applications of fungicides are used throughout the growing season (Lamey et al., 1987; Shane and Teng, 1992; Rangel et al., 2020; Liu et al., 2023). While efforts to breed enhanced CLS resistance into sugar beet is showing promising results, it is still ongoing and the commercial varieties that are currently available provide only partial crop protection that still require multiple applications of fungicides during the growing season to keep CLS symptoms to a minimum (Panella and Lewellen 2007; Khan et al., 2008; Vogel et al., 2018; Song et al., 2023).
Deployment of the most current integrated pest management (IPM) strategies such as disease prediction models, precisely timed fungicide applications, crop rotation practices/extensive field tillage, and the utilization of superior genetics with enhanced disease resistance traits in sugar beet have helped significantly in reducing CLS in sugar beet (Windels et al., 1998; Wolf and Vereet, 2005; Khan et al., 2007; Vogel et al., 2018; Kiniec et al., 2020; Memic et al., 2020; El-Jarroudi et al., 2021; Hernandez et al., 2023; Song et al., 2023). However, in warm humid growing regions, such as in the North Central and Great Lakes growing region of the United States, as well as the southern European growing region, heavy CLS outbreaks still occur yearly (Windels et al., 1998; Skaracis et al., 2010; Gummert et al., 2015; Vogel et al., 2018; Rangel et al., 2020; Spanner et al., 2022; Liu et al., 2023).
The most resilient and sustainable CLS reduction strategy from a circular agriculture perspective is to incorporate robust CLS resistance traits into sugar beet hybrid cultivars (Brown 2002; Taguchi et al., 2011; Vyska et al., 2016; Vogel et al., 2018). Progress is being made on this front with the recent incorporation of a new CLS resistance trait into commercially available sugar beet hybrid cultivars currently in the fields (Vogel et al., 2018; Emam et al., 2022). While this new trait has helped significantly in combating CLS pressure in sugar beet fields, the trait does not offer complete disease protection, and still requires the use fungicides (though less) to limit damage and maximize sugar yields (Emam et al., 2022).
Because of the biannual nature of the sugar beet lifecycle—compounded by the fact that all commercially available sugar beet cultivars are hybrids generated through complex cytoplasmic male sterile (CMS) crossings—breeding new and novel disease resistance traits into sugar beet can take close to a decade to be commercialized (Karakotov et al., 2021). Traits that are polygenic or recessive in nature can take even longer to be commercially realized. Marker assisted selection (MAS), next generation sequencing (NGS), and other molecular techniques have revolutionized sugar beet breeding programs by allowing early seedling selection of plants introgressed with disease resistant traits or even stacked events, thus shortening the breeding pipeline by months or even years (Karakotov et al., 2021). However, these molecular-based methods have limited utility if there is no prior knowledge of the genetic underpinnings for the observed disease resistant trait such as when introgressing from wild beet relatives or from mutagenized populations.
There is still no substitute for careful phenotyping when identifying new and novel disease resistance traits when the genetic causal variants in the genome are not known. When testing for CLS resistance in the field under natural epidemics of CLS, unsatisfactory outcomes can result because of low disease intensity. Even with artificial inoculations of Cercospora beticola in field CLS nurseries, favorable environmental conditions are still required for producing moderately severe and uniform disease epiphytotic conditions (Ruppel and Gaskill, 1971; Jansen et al., 2014). Furthermore, selecting individual plants with resistance out of heterogenous breeding populations in the field is difficult because of the masking effects from environmental and nutritional factors (Xu 2016; Louwaars et al., 2018). Wild beet relatives or mutagenized populations that are frequently incorporated into pre-breeding lines in hopes of finding new and novel disease resistance traits often lack sufficient agronomic traits—such as uniform germination or early seedling vigor (Lewellen and Panella, 2007). This substantially reduces uniform field plot establishment and complicates evaluation and selection of the CLS resistance traits.
As a way to expedite the early-stage phenotyping when identifying and characterizing new and novel disease resistance traits, we initiated this study to determine the utility of using greenhouse Cercospora leaf spot (CLS) screening assays in a sugar beet pre-breeding pipeline. Recently, the sugar beet germplasm, KEMS06 (PI-663873), was found to have high CLS resistance in two separate field trials (Eujayl et al., 2022a; Eujayl et al., 2022b). The KEMS06 germplasm was derived from an ethyl methanesulfonate (EMS)-mutagenized population whose sibling cohorts have shown diverse and tractable phenotypes in many disease resistance breeding studies (Eujayl and Strausbaugh, 2014; Eujayl and Strausbaugh, 2016; Eujayl and Strausbaugh, 2018; Majumdar et al., 2023), suggesting that the KEMS06 CLS resistance trait may contain genetic underpinnings that have not been leveraged before in commercial sugar beet cultivars. Therefore, we investigated the utility of using greenhouse CLS resistance screening assays to phenotypically track the introgression of the KEMS06 CLS resistance trait into the double haploid line KDH13 (PI 663862) and its full sibling double haploid cohort, KDH4-9 (Eujayl et al., 2016). Because plant double haploid genomes are nearly homogenous (Baenziger, 1996; Gurel et al., 2021), crosses with double haploids allow the generation of ‘clean genomic scaffolds’ to genetically track the causal variants linked to observed phenotypes in genome-wide association studies (GWAS) and to generate accurate molecular markers for marker assisted selection (MAS) breeding approaches (Taguchi et al., 2011; Bernardo 2020). Both KDH4-9 and KDH13 are also extremely susceptible to CLS (Eujayl et al., 2022a; Eujayl et al., 2022b) allowing us to observe and measure the segregation processes from one successive filial generation to the next. In this study, when using greenhouse CLS resistance screening assays, the important plant selection criteria metrics that we used for successful phenotyping outcomes in a segregating population are discussed as well.
Materials and Methods
Plant Material:
Sugar beet lines used in this study were developed by the United States Department of Agriculture-Agricultural Research Service (USDA-ARS) sugar beet program at Kimberly, Idaho, USA (Eujayl et al., 2016; Eujayl et al., 2022a; Eujayl et al., 2022b). The CLS-resistant parent used in this study is KEMS06 (PI-683514), a germplasm line isolated from an ethyl methanesulfonate (EMS)-mutagenesis population study (Eujayl and Strausbaugh, 2014). KEMS06 is homozygous self-fertile (SF), homozygous for multigerm seed (MM) and red hypocotyl color (RR). We used these traits to phenotypically track successful hybridizations in the hybrid progeny from one filial generation to the next. Two separate resistant x susceptible hybrid crosses were performed using KDH13 (PI 663862) and its full sibling cohort (KDH4-9) as the respective CLS-susceptible parental lines. Both KDH13 and KDH4-9 are homozygous self-fertile (SF), and homozygous for the recessive traits monogerm seed (mm) and green hypocotyl color (rr). KEMS06 was the pollen donor in these two cross-pollination events to generate the following hybrids:
Cross1 = KDH4-9 x KEMS06
Cross2 = KDH13 x KEMS06
In this report, the shorthand names Cross1 and Cross2 were used interchangeably for full hybrid names, KDH4-9 x KEMS06 and KDH13 x KEMS06, respectively. Filial generation was denoted in a suffix when necessary. Phenotypic analysis of the progeny from these two crosses was carried out to the F3 generation for Cross1 and F4 generation for Cross2. Seeds from both hybridizations were allowed to mature, then seeds were harvested from the KDH4-9 and KDH13 parental lines only. F1 progeny from these crosses were identified by red hypocotyl color in the newly emerged seedlings and proceeded forward with these only.
Standard plant growth conditions:
Unless specifically noted, all plant material discussed in this report used the following plant growth conditions. Sugar beet seeds were destemmed, scarified, and sown at a rate of 2-3 seeds per 5 x 7.6 cm pot (24 pots per flat) into soil-less potting mix (Sungrow; Agawam, MA, USA). Plants were thinned as necessary to 1 plant per pot (24 per flat). For the F1 seed from Cross1 and Cross2 in which the red hypocotyl seedlings were selected, all the green (rr) hypocotyl seedlings were removed. Plants were then grown for eight weeks under greenhouse conditions. Slow-release fertilizer (Osmocote 14:14:14; Scotts-Sierra Horticultural Products Company, Marysville, OH) was incorporated into the potting medium before planting at a rate of 17.5g/liter of medium to supply adequate nutrients. Supplemental lighting (LED broad spectrum grow lights; PHOTOBIO, Hydrofarm, Petaluma, CA) was used in the fall/winter/spring months to maintain an 18 hr. light-cycle. Greenhouse temperatures were regulated to 21-27 °C unless noted. Plants were vernalized at 4 °C for 16 weeks in a growth chamber (supplemented with constant dim fluorescent light). After 16 weeks, plants were acclimated to bolting/flowering conditions by slowly ramping up the temperature from 4 °C to 18 °C over a period of four weeks (22 hr. light-cycle) supplemented with constant red light (~660 nm) using a single red LED bulb for a 3 m2 space. Plants were then placed back into the greenhouse and maintained under long-day (22 hr.) light conditions supplemented with constant red light (~660 nm). Adequate water was supplied to keep the soil moist but not water-logged and a second dose of 14:14:14 slow-release fertilizer was applied at a rate of 17.5g/liter of medium. For seed production from Cross1 and Cross2, unless specifically noted in the report: when flowering commenced, the plants were grouped according to the hybrid crosses and placed inside enclosed fabric tents to promote bulk cross-pollination within each cross. Bulk F2 seed was allowed to mature and then harvested. For hybrid Cross2 (KDH13 x KEMS06), a second round of bulk cross-pollination was performed and bulk F3 seed was harvested prior to any phenotypic selection occurring.
Greenhouse Cercospora leaf spot (CLS) assay:
Plant growth conditions: Using our standard protocol described above with the following modifications: Seedlings were thinned to one plant per pot and allowed to grow for 3-4 weeks until the 8-10 leaf growth stage. Previously published greenhouse based CLS screening methods have established that high humidity (≥95%) and temperatures in the range of 27-32 °C are required to establish Cercospora beticola infection in sugar beet (Rossi et al., 1999, Rossi et al., 2000, Khan 2008). However, in order to achieve a more uniform and consistent C. beticola leaf infection on sugar beet leaves for individual plant selections, we found it necessary to also acclimate the plants to near 95% humidity and 27-32 °C two weeks prior to treatment and maintain plants inoculated with C. beticola at high humidity throughout the duration of the experiment. Pilot experiments determined that open benchtop greenhouse experiments could not consistently achieve this environmental condition throughout the day and night. For CLS studies in the greenhouse, clear plastic tents (60 cm. x 60 cm. x 60 cm; BugDorm Mfg., Taiwan) were wrapped tightly on the outside with a layer of clear plastic sheeting to maintain a constant 95% humidity and 27-32 °C throughout the duration of the experiment. During the summer months, venting had to be monitored during the hottest times of the day to maintain these conditions without overheating.
Source of inoculum: Sugar beet leaves infected with Cercospora beticola were harvested from select fields in southern Idaho that have shown yearly outbreaks for the last 10 years (areas endemic to Idaho). The leaves were laid out as a single layer on the lab bench and air dried at ambient temperatures for two to three days. Leaves were hand crushed and stored in air-tight containers at 4 °C until ready to use in the greenhouse CLS index ratings assay. Dried leaves were stored no longer than 12 months (harvested from the previous field season) before being used in the CLS greenhouse assays. To verify the presence of Cercospora spores within the leaf spots, microscopic examination was routinely performed on freshly harvested leaves from the field as well as leaves from the greenhouse CLS assay.
To make the inoculum and application: 30 grams of crushed leaves were added to 500 ml of deionized water in a 1 L beaker and allowed to gently shake at room temperature for eight hours. The inoculum was filtered through three layers of cheese cloth, and spores were counted using a hemocytometer and diluted with deionized water to application strength (~1×10³-1×10⁴ spores/ml). Inoculum was applied using a manual hand sprayer (ZEP, Atlanta, GA) on both sides of all the the sugar beet leaves of the plant until dripping. 500 ml of inoculum was enough to treat eight flats of plants (four tents worth). Plants were arranged in the flats in a random block design to minimize error in application or variability in the environmental conditions. A susceptible check (KDH13 or KDH4-9) was used in every experiment to verify the efficacy of the treatments. Because greenhouse experiments are not afforded C. beticola’s cyclic spore reinfection process that field nurseries rely on to achieve robust disease outcomes (Ruppel and Gaskill, 1971), a second inoculation is applied to the leaves 10 days later as outlined above to allow for a second potential infection period to occur per treatment.
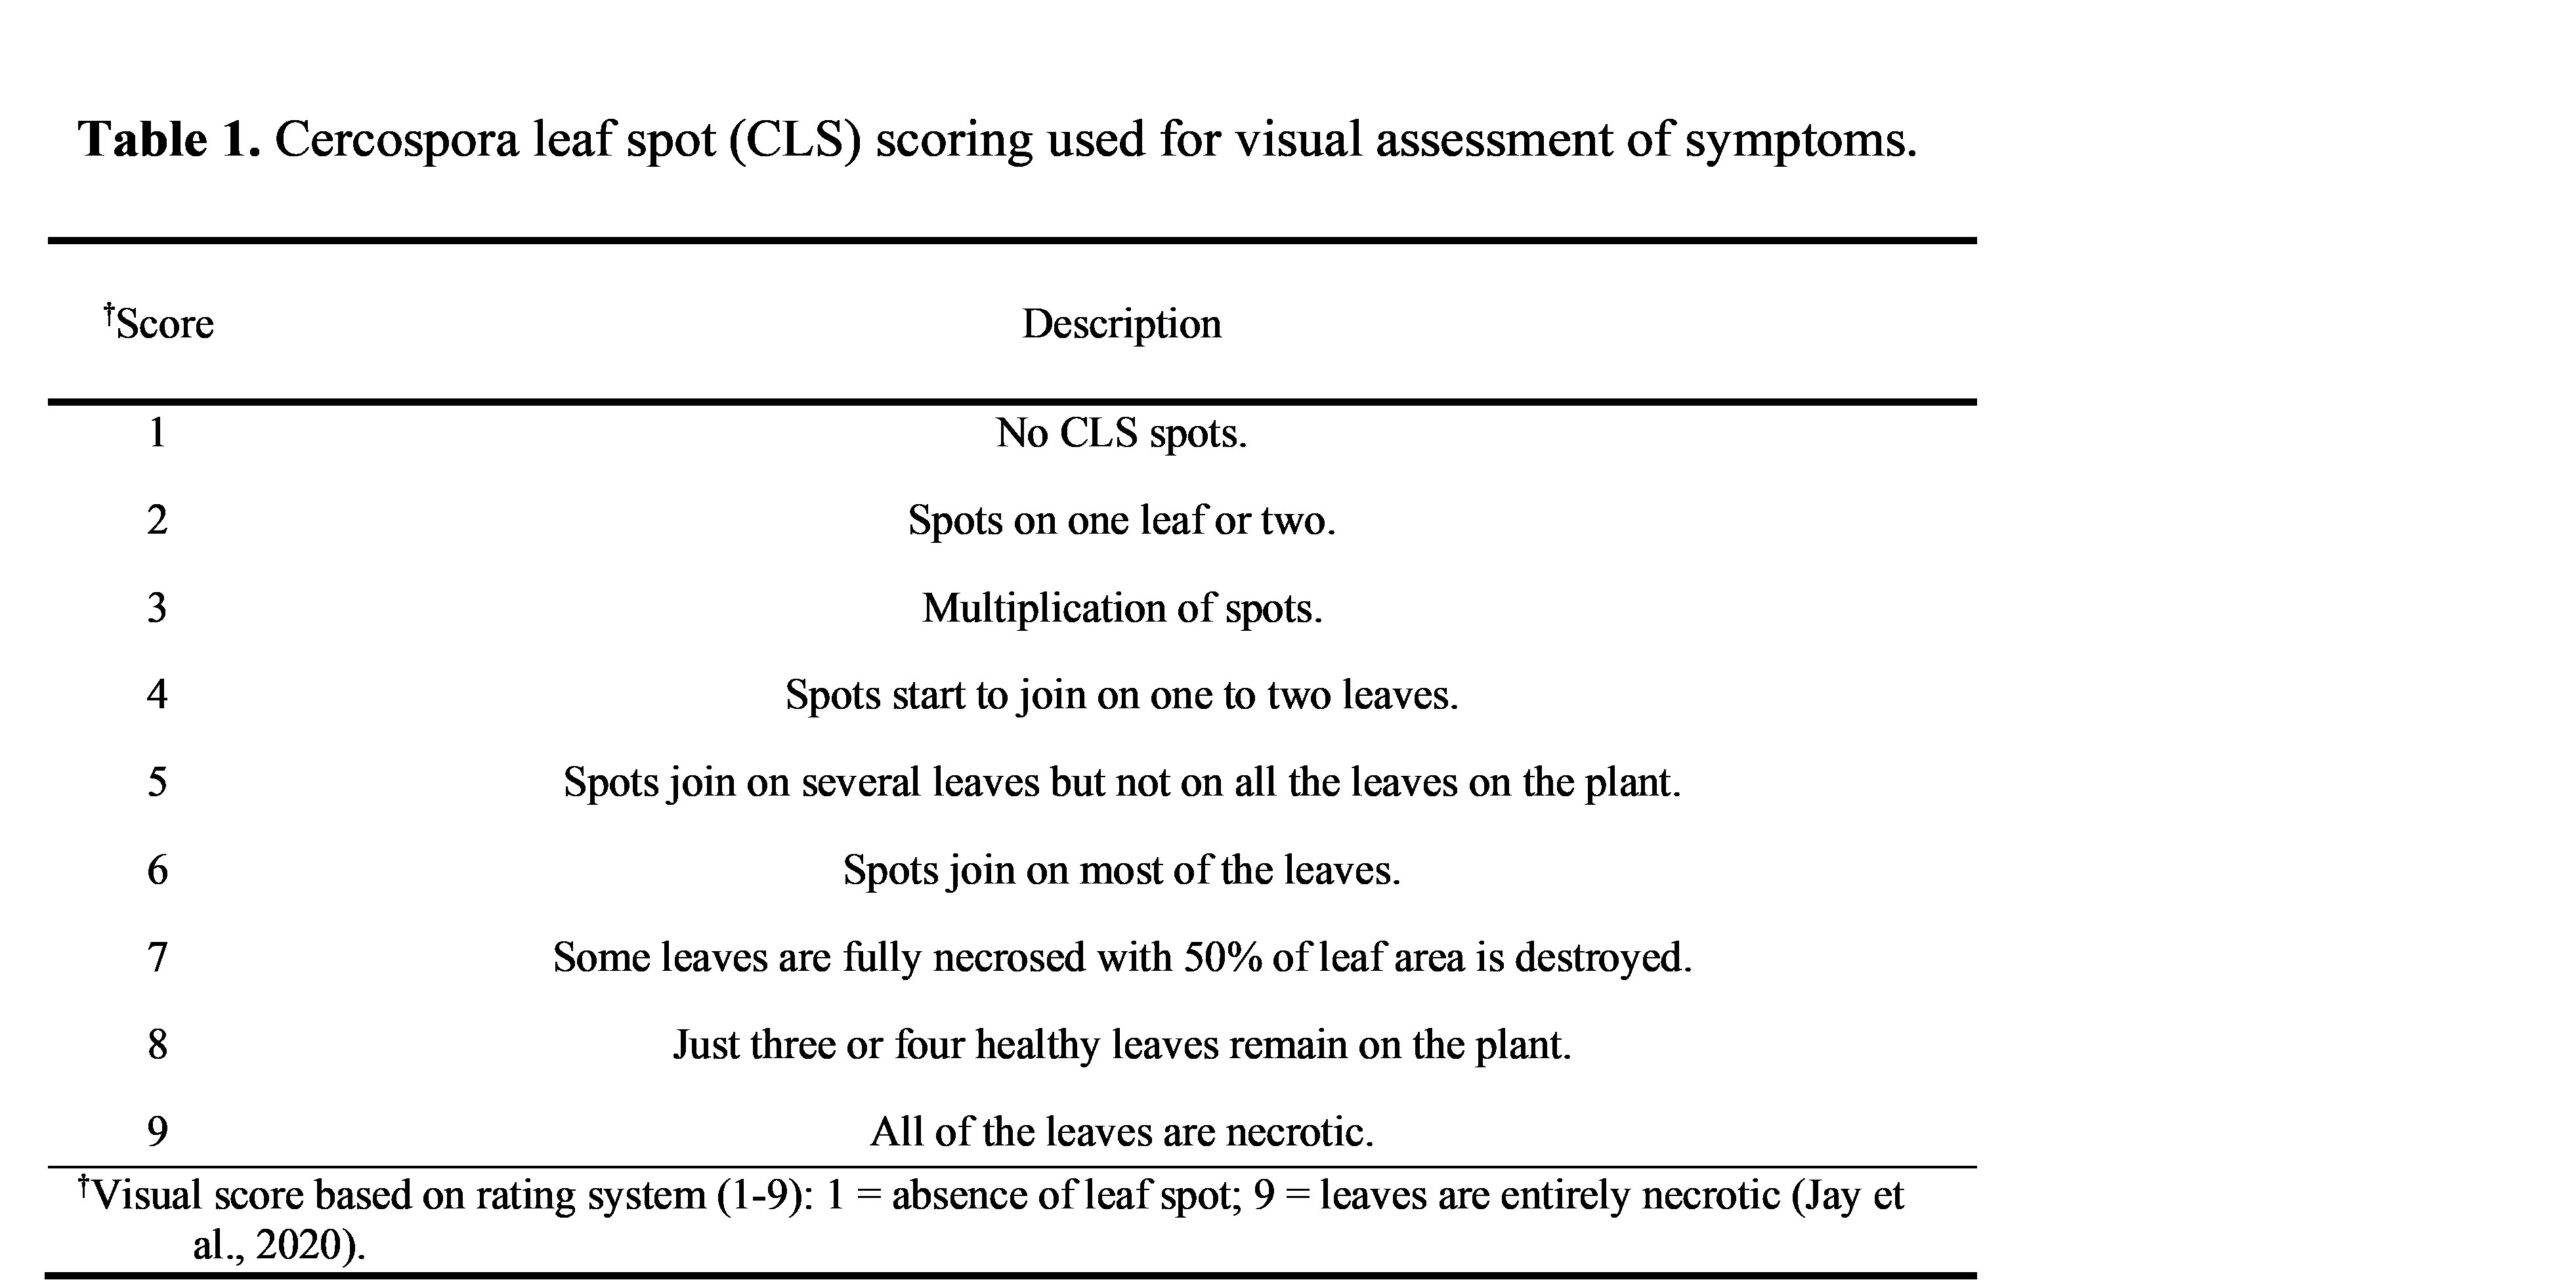
Scoring CLS on sugar beet: After the second application of the inoculum, the sugar beet plants remained inside the clear plastic tents throughout the duration of the experiment. Three weeks after the second application of the inoculum, plants were removed from the plastic tents and scored following established methods (Ruppel and Gaskill, 1971; Hanson et al., 2014; Atoum et al., 2015; Jay et al, 2020). Briefly, plants were individually inspected and scored using a disease index rating from 1 to 9 (whole numbers) as described in Table 1. Three separate experts were employed when rating the individual plants in the Cross1-F2 and Cross2-F3 segregating populations. For subsequent ratings in the progeny families, ratings were done by a single expert. Plants that were selected to proceed in the breeding pipeline were removed from the diseased flat, cleaned up by removing all symptomatic leaves and put into clean greenhouse nursery flats for four weeks to recover. They were then moved to vernalization conditions for bolting and flowering as described in our standard plant growth conditions section of this report.
Data analysis:
Raw data was presented wherever possible in this report. Statistical analysis following established methods was performed on select data sets as indicated in the report when necessary to clarify findings or conclusions. P-values were determined using paired t-test (two-tailed) analysis at either the .05 confidence level (*) or .005 confidence level (**). For greenhouse assays, the mean disease index () of the population was determined using the following equation:
Where (is the sum of the individual ratings divided by the total of number of individual plants () in the population (Ruppel and Gaskill, 1971; Ali et al., 2016). To determine the variance () of the population the following formula was used:
Where () is the sum of all the squared differences between each data point and the mean, divided by the total number of individual plants () in the analyzed population (Ruppel and Gaskill, 1971; Ali et al., 2016).
Results and Discussion
Disease Indices of the Parental Lines:
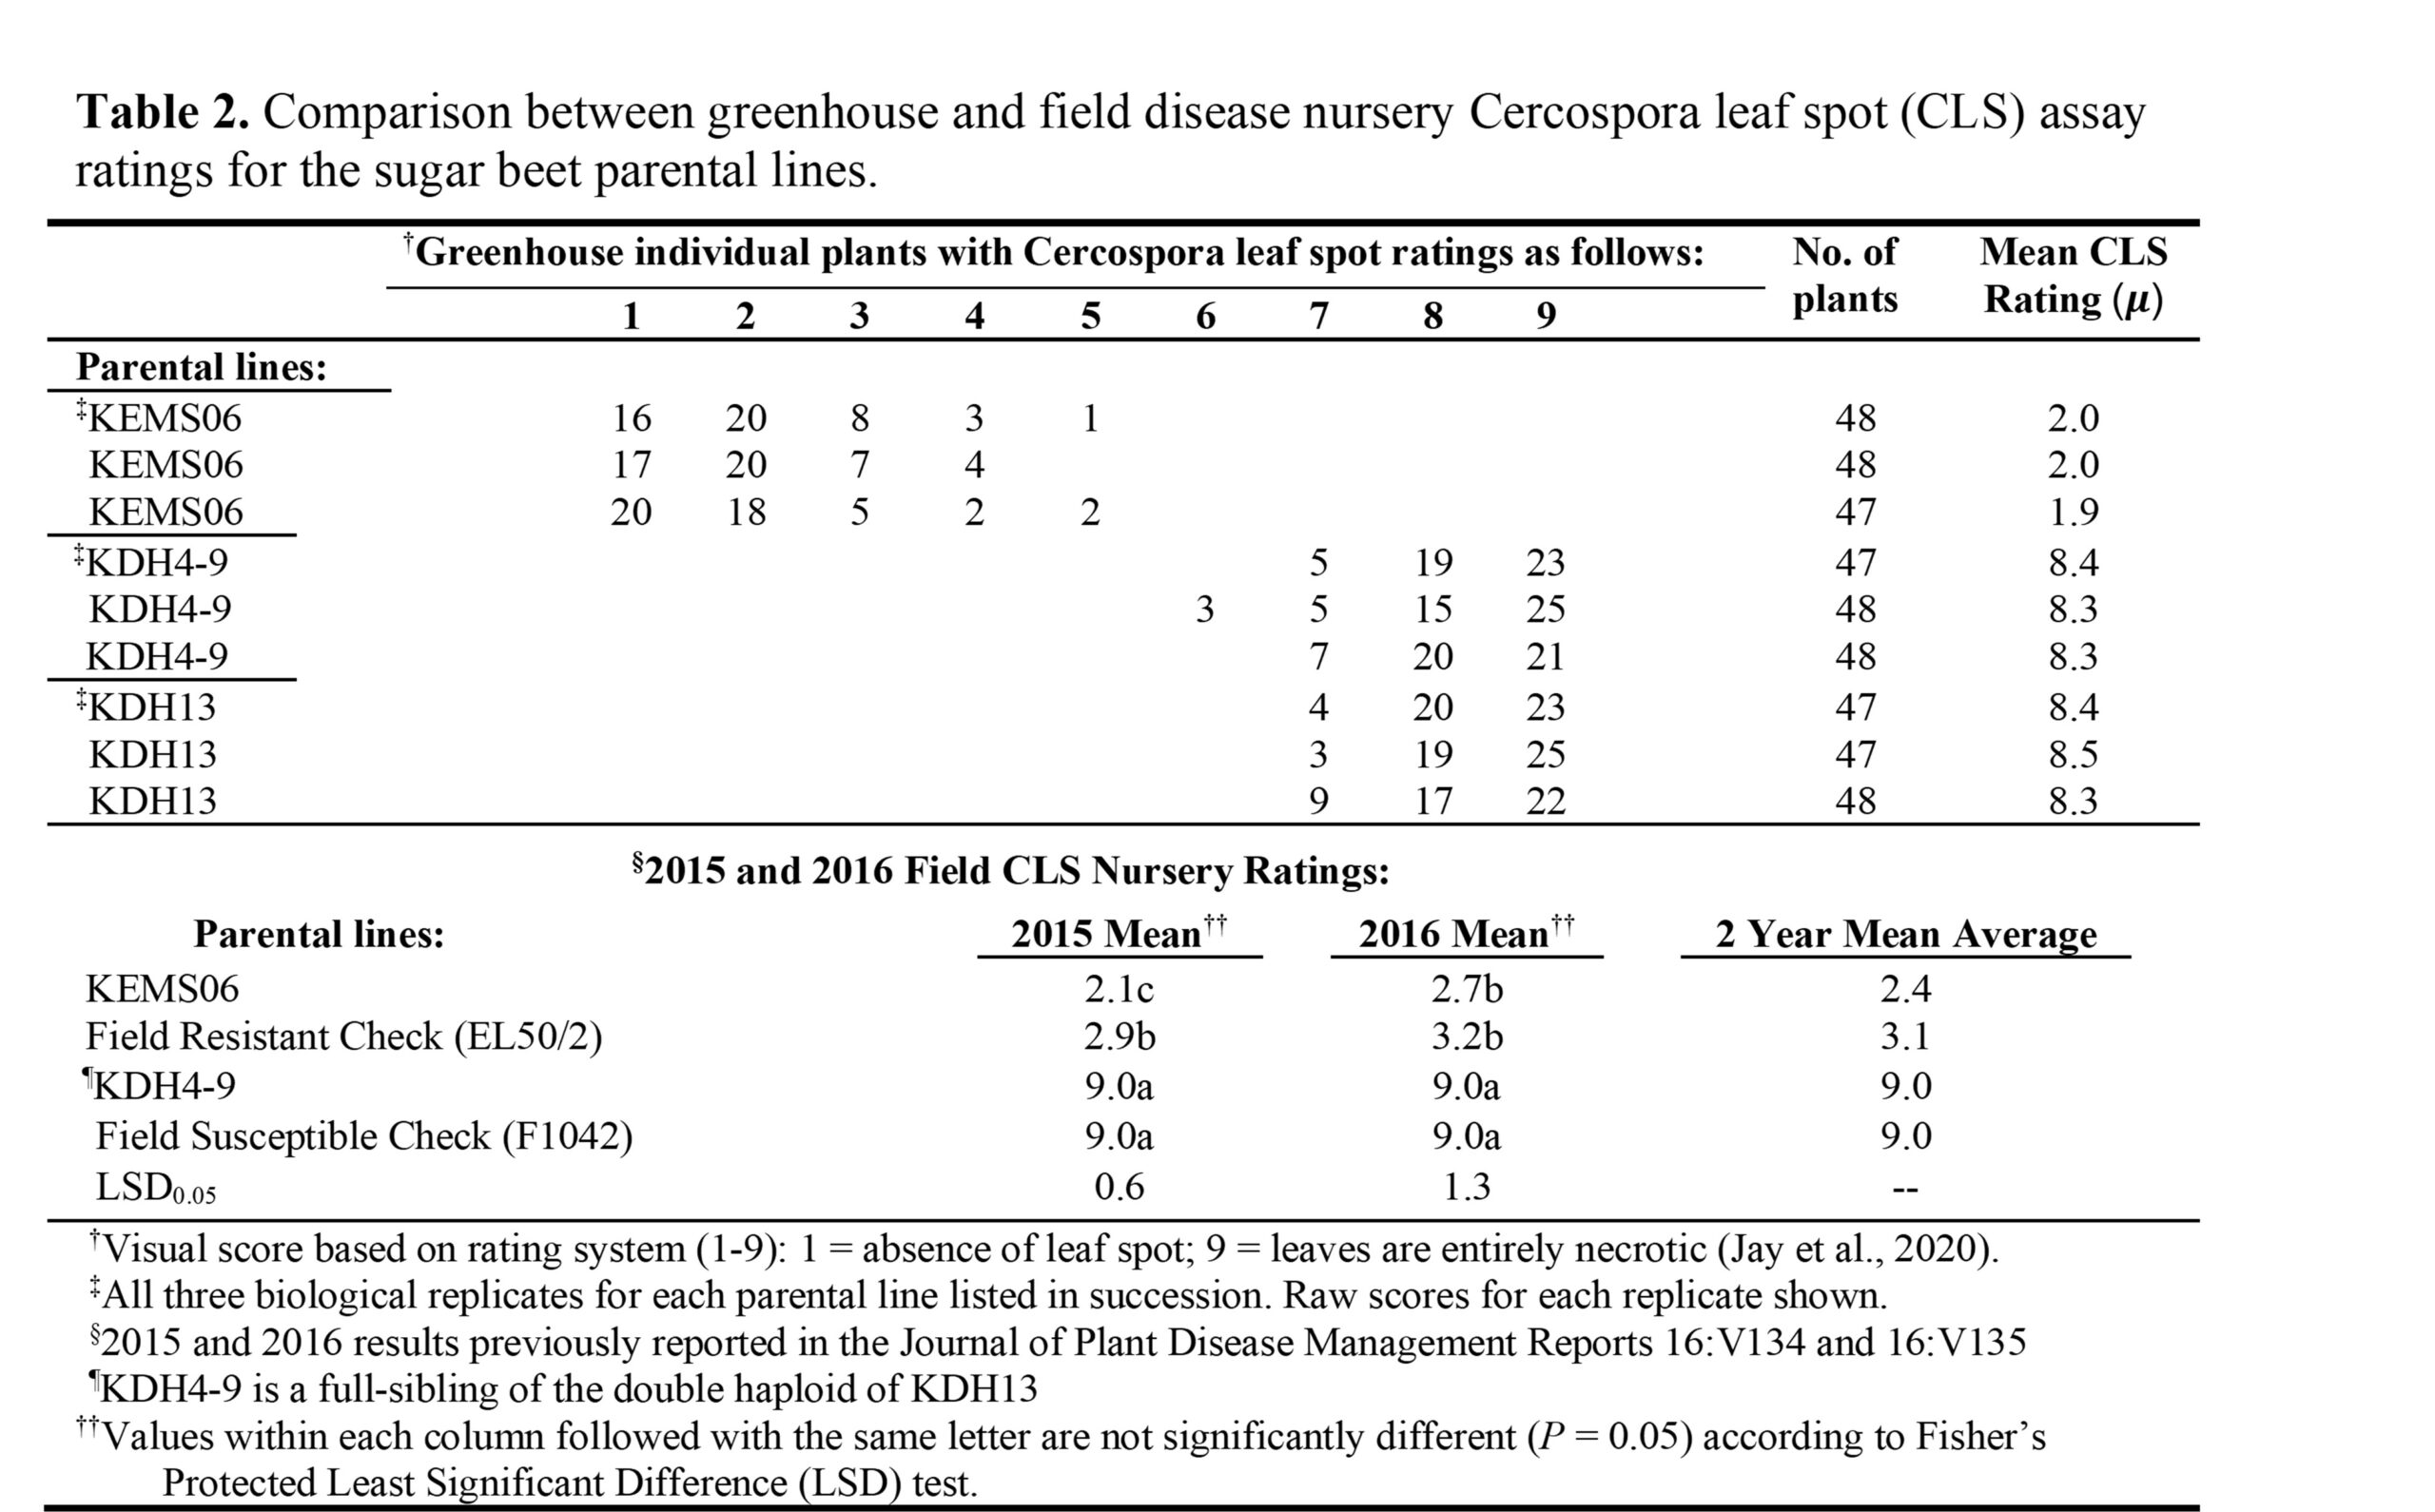
In this study we first wanted to establish the phenotypic selection criteria at the individual plant disease rating level for the parental lines. By using this methodology, we could then apply the appropriate individual plant selection parameters to the phenotypically segregating populations Cross1-F2 and Cross2-F3 to give as stringent phenotypic selection of the individual plants being assayed as possible without missing any of the genetic determinants underlying the CLS resistance of the KEMS06 line. The greenhouse CLS ratings of the parental lines are presented in Table 2 as individual plant frequency distribution across the disease rating scale. The CLS-resistant KEMS06 parental line, had a frequency distribution that ranged from 1 to 5 with a mean disease index of 1.9 to 2.0 between the three separate biological replications (47-48 plants per rep; Table 2). The two CLS-susceptible parental lines (KDH4-9 and KDH13) used in this study had frequency distributions on the opposing end of the disease rating scale spectrum with frequency distributions between 5 and 9, and mean disease index scores between 8.3 and 8.5. We compared the results from two CLS field nursery experiments that were performed in 2015 and 2016 with our greenhouse CLS ratings results (Table 2). Field trial disease ratings for KEMS06 were slightly higher (more susceptible) with a 2 year mean average of 2.4 compared to the greenhouse assay mean of 2.0. In the field, KEMS06 showed significantly more CLS resistance than the resistant check used in the field assay in both years. On the other end of the ratings spectrum, the field results presented in Table 2 show that the susceptible parental line, KDH4-9, in the field was equal in disease severity to the CLS susceptible check with a disease index rating of 9 for 2 years in a row. The greenhouse disease index rating for KDH4-9 for all three biological reps was between 8.3 and 8.4.
To analyze the disease indices of the parental lines with more scrutiny, the individual plant frequency distributions of the parental lines were plotted in histogram format in order to establish the individual plant selection stringency parameters (Figure 1A). For the resistant KEMS06 parental line, the difference in the number of plants in disease rating 1 vs 2 was statistically insignificant (p-value 0.46), but then drops significantly at rating 3 on the disease scale (p-value 0.0006). Both susceptible parents also showed a tight clustering result in the histograms at the susceptible end of the rating scale (Figure 1B and 1C). No individual plant selection overlapped on the ratings scale between the susceptible parental lines and resistant KEMS06 parental line which gave us additional confidence that we would be able to select individual plants with CLS resistance trait from in the segregating hybrid populations (Table 2). Based on these results, the individual plant selection stringency parameters were set to a selection cutoff level of less than or equal to 2, so that when we began scoring the Cross1-F2 and Cross2-F3 segregating populations for CLS resistance, individual plants that scored 1-2 (more resistant) would be selected to proceed forward in our breeding pipeline and plants that scored 3 or higher (more susceptible) would be
Disease Indices of the segregating hybrid populations
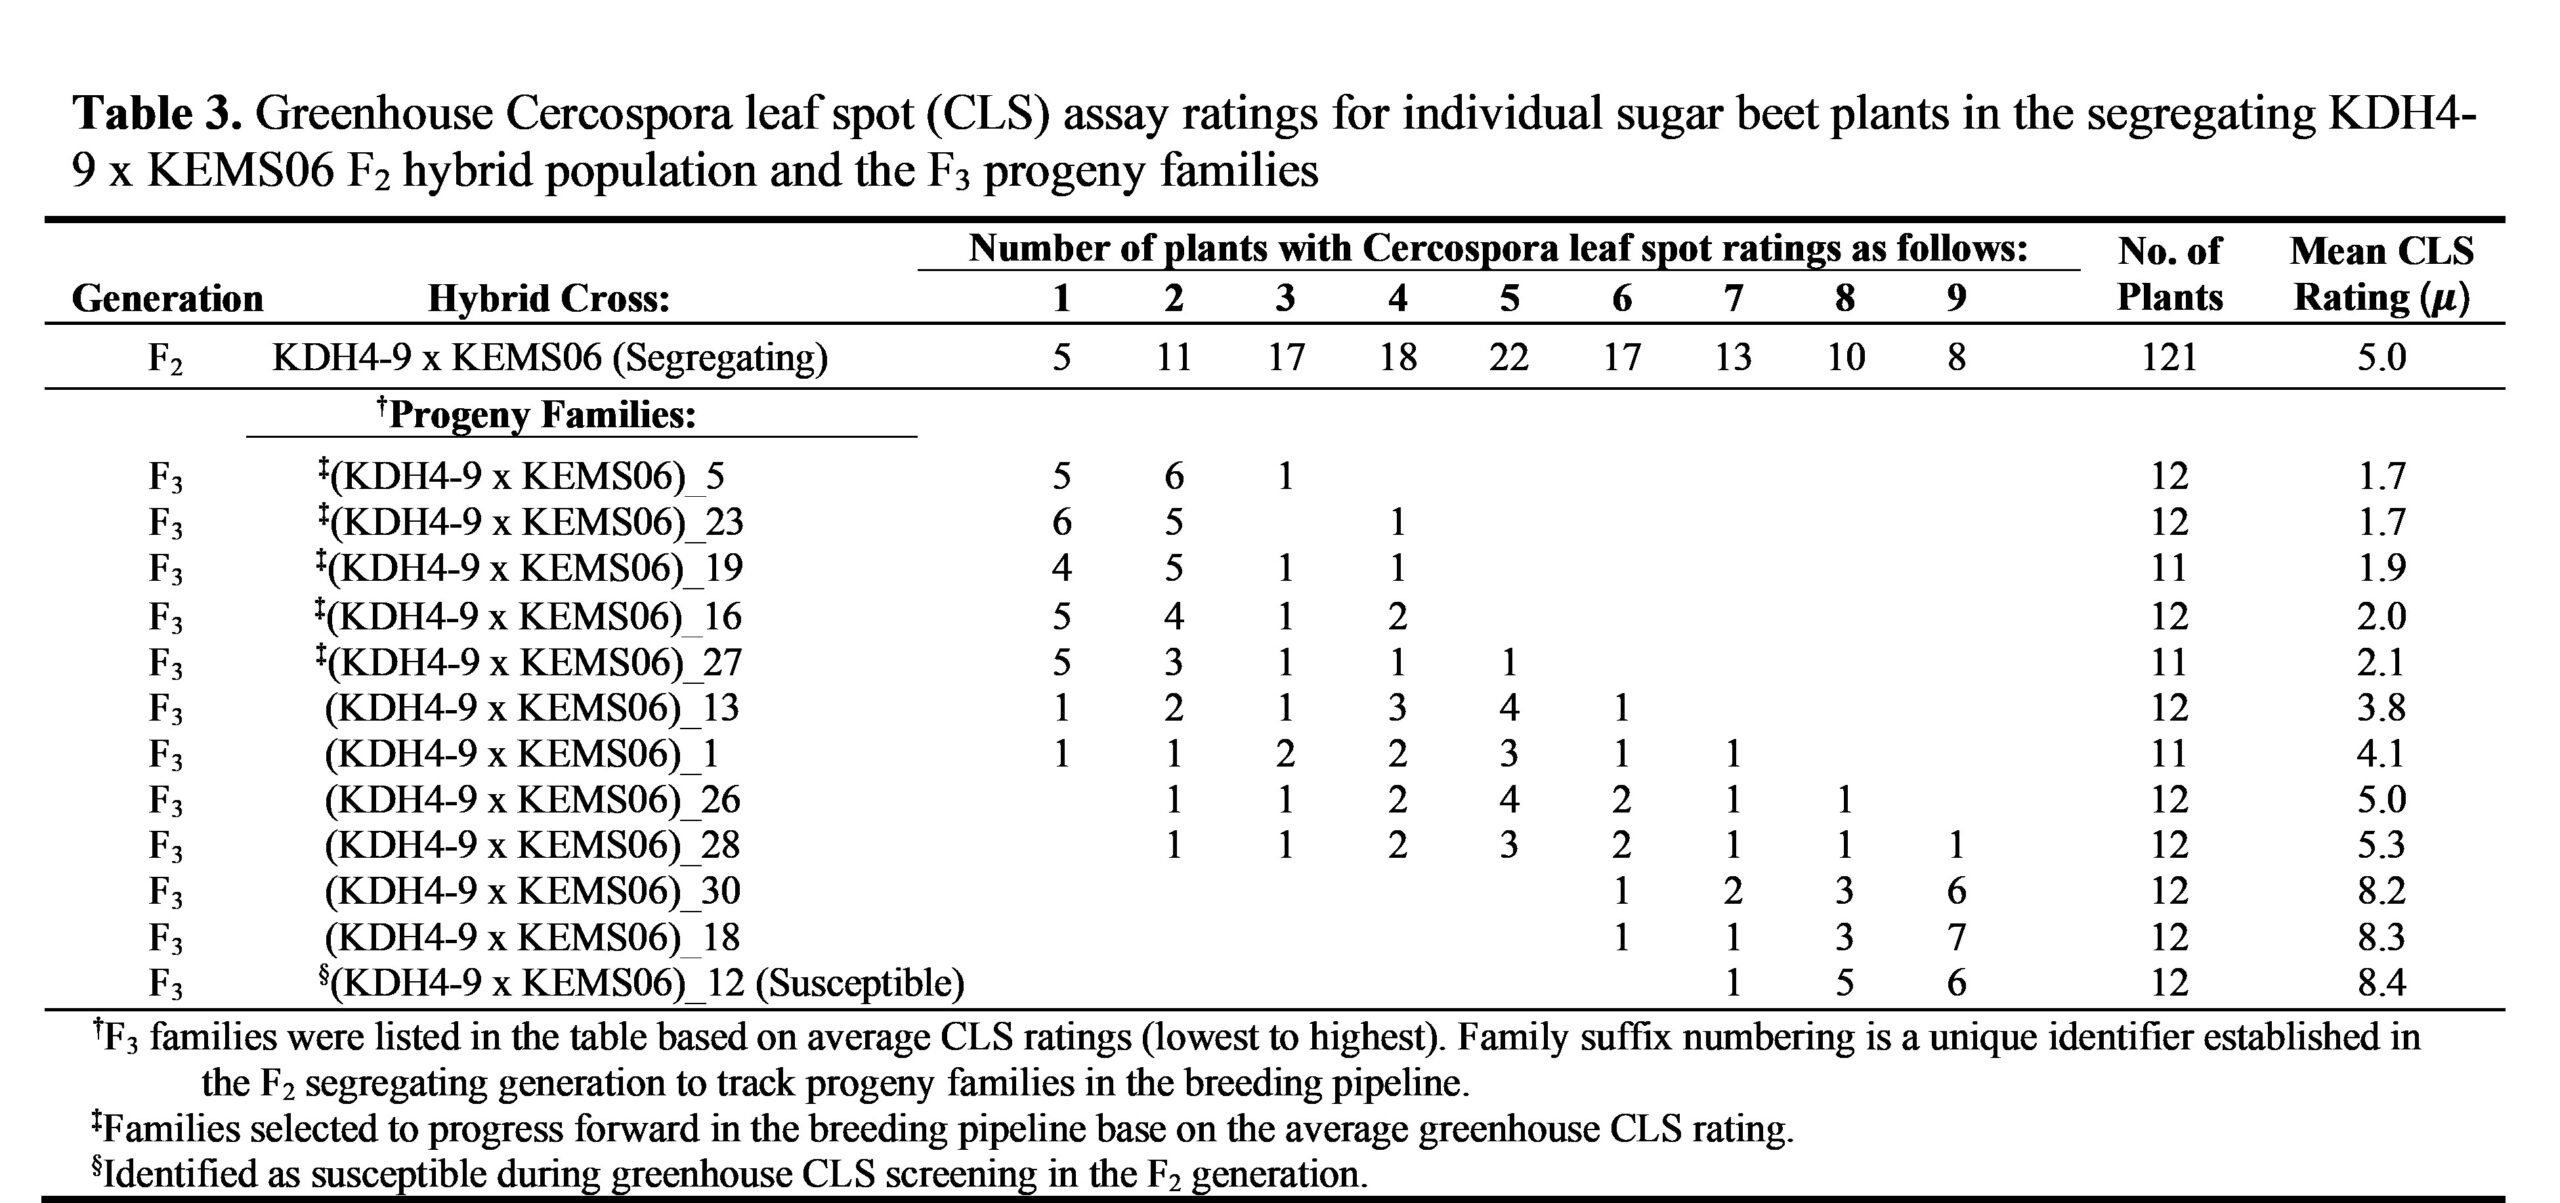
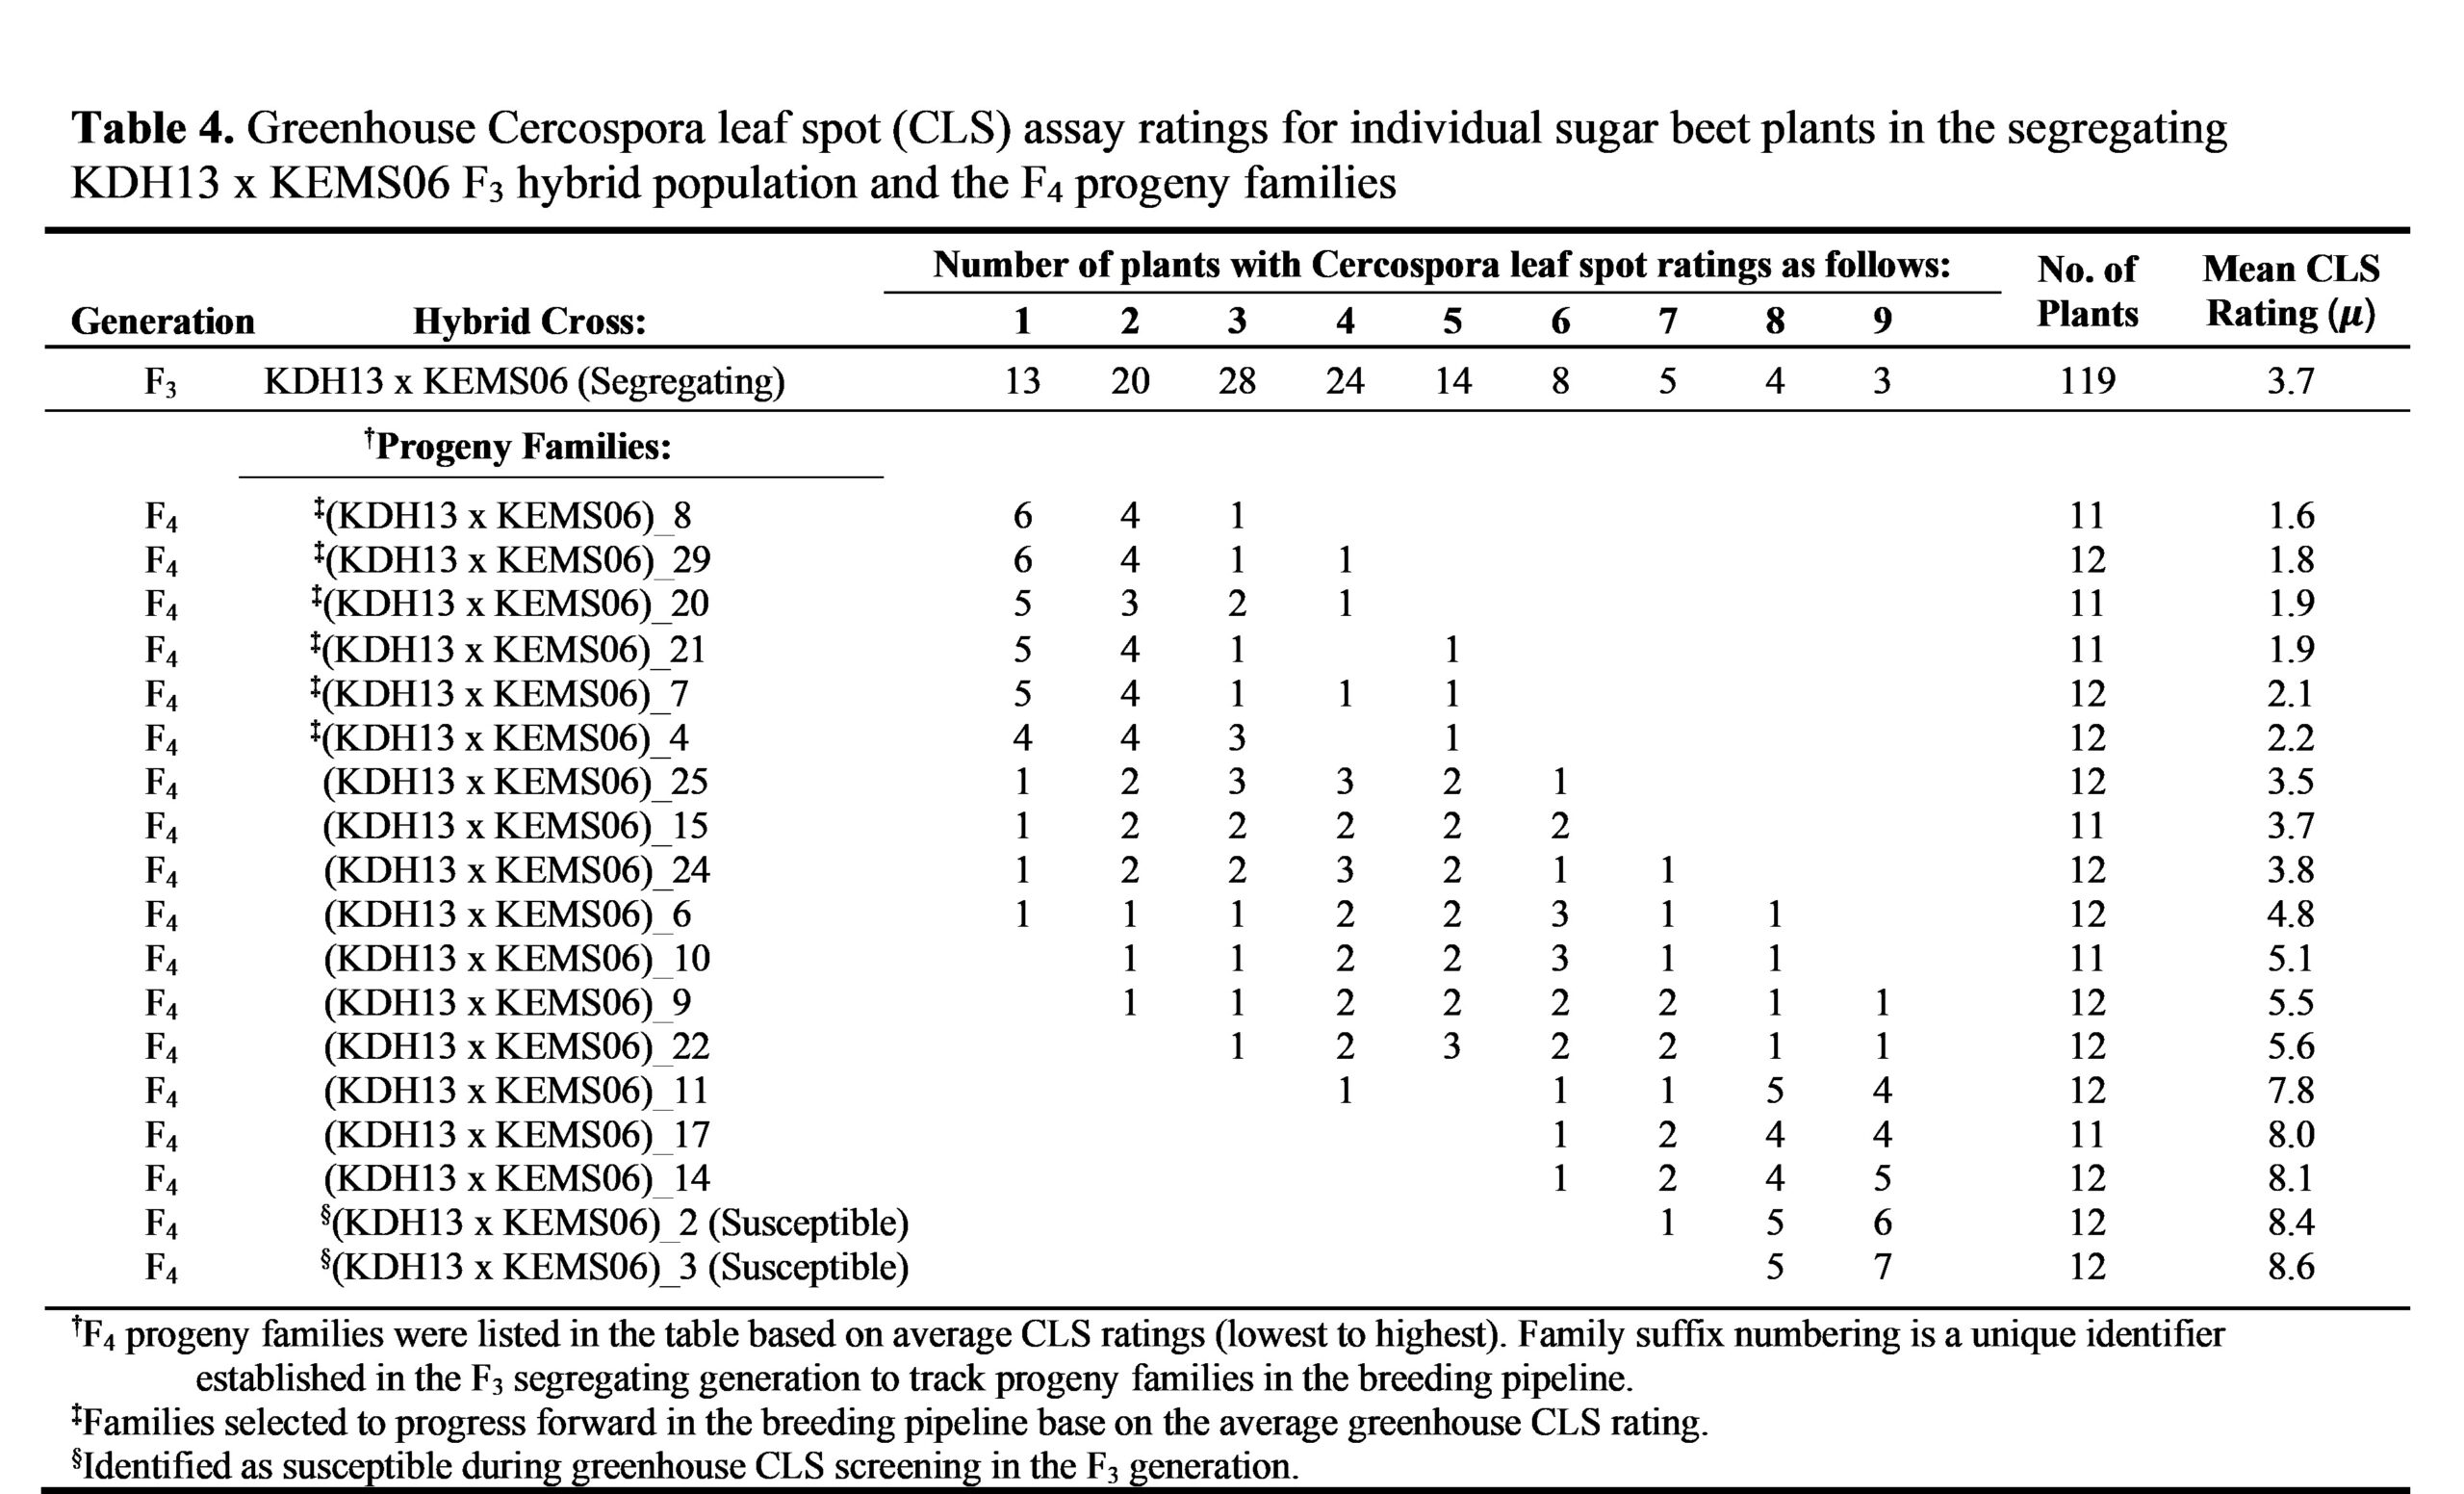
To have a large enough population of segregating disease resistant plants with a rating of 2 or less to move forward with in the breeding pipeline, the sampling size that we used in the parental lines was scaled up to 121 plants in the Cross1-F2 segregating population and 119 plants in the Cross2-F3 segregating population. The greenhouse CLS ratings for the phenotypically segregating populations of these two hybrid crosses are presented on the first lines of Tables 3 and 4 as individual plant disease rating frequency distribution across the rating scale. In contrast to the results with the parental lines, the segregating populations for both hybrid crosses in this study showed a rating distribution that was spread across the disease index scale (ratings 1 through 9) with a greater proportion of individual plants scoring between 3-5. The mean population disease indices were calculated to be 5.0 and 3.7 for Cross1-F2 and Cross2-F3
The disease ratings were visualized by plotting the individual plant disease index frequency distributions in histogram format for the segregating populations of Cross1 and Cross2 (Figure 1D and 1E). The observed phenotypic variance () was calculated for these two segregating populations, with Cross1-F2 having an observed disease rating variance of 4.38 and Cross2-F3 having a variance of 3.79 (Figure 1D and 1E insets). This is in contrast to the parental lines had very low variance scores with the resistant KEMS06 parent line having a variance score of 0.98 and the two susceptible parental lines, KDH4-9 and KDH13, having respective 0.80 and 0.42 variance scores (Figure 1A-C insets). This higher variance ratio of the segregating populations to the parental lines suggests that this CLS resistance trait is a quantitative trait made up of two or more genetic determinants, especially when environmental contributions to the observed variance scores are minimized as is the case with our controlled environment greenhouse experiments (Bernardo 2020).
Using the individual plant selection stringency parameters that we established when analyzing the parental lines (cutoff being a disease score of 2 or less), there were 16 plants that scored 2 or less in the Cross1-F2 segregating population and there were 33 plants that scored 2 or less in the Cross2-F3 segregating population. By using these stringent selection criteria, there were twice the number of Cross2-F3 segregating population plants that had a disease index score of 2 or less. There are various reasons why this could be the case including inconsistencies in the greenhouse-controlled environment or that the KDH13 sugar beet germplasm is positively contributing genetically to the observed CLS resistance in the Cross2 hybrid. However, a major difference between Cross1-F2 and Cross2-F3 is that Cross2-F3 is in the third filial generation before selection took place.
When we initiated this study to characterize at the CLS resistance trait in KEMS06, Cross2 was farther along in our pre-breeding pipeline. Because Cross2 was kept isolated during the first bulk pollination (F2) cycle, this was considered a ‘bulk increase’ of the Cross2 family. However, with closer scrutiny to our plant vernalization methods, we realized that in order for us to be selecting the CLS resistance trait in the F3 generation, Cross2-F3 actually proceeded through an additional vernalization period (two vernalizations in total) that Cross1-F2 did not go through. Considering that each vernalization period has a duration period of 4 months at 4 °C with near 100% humidity, vernalization storage is typically stressful on sugar beets, and we have observed upwards of 10-20% loss to root rot or desiccation. While we have not fully investigated this aspect with KEMS06 yet, this ‘loss to root rot’ during vernalization may be inadvertently selecting for plants that are more resistant to root rot than the other individual plants in the Cross2-F2 cohort. Cross-platform speaking, the KEMS06 trait may actually be a broad-spectrum fungal disease resistance trait with pleiotropic effects—improving both root rot resistance and Cercospora beticola resistance in sugar beet. In support of this hypothesis, the KEMS06 germplasm was noted in a previous study as having ‘superior’ storage rot resistance—with 50% better than the commercial resistant check used in the study (Eujayl and Strausbaugh 2018). While vernalization stress may have enriched the number of plants resistant to some fungal pathogens in the Cross2-F3 on the outset, it did not change our CLS rating selection criteria in the greenhouse of having 2 or less on the disease rating scale. Thus, our conclusion here is that the extra vernalization cycle just increased the number of plants we selected in the Cross2-F3 segregating population.
While all 49 plants that were selected from both of the segregating populations (Cross1-F2 and Cross2-F3) proceeded forward in our breeding pipeline, there was non-uniformity in the bolting and flowering in our greenhouses which resulted in unsynchronized flowering events within larger groups of plants as a whole. Consequently, this resulted in the progeny families being separated into two groups and batch-processed sequentially based on earlier flowering (30 plants) and later flowering (19 plants). Both batches had sufficient numbers of plants from the two segregating populations (including susceptible examples) to give us confidence to report on the results from the first batch here.
Disease Indices of the Progeny families
While the large phenotypic variances measured in the Cross1-F2 and Cross2-F3 segregating populations may result from underlying genetic determinates segregating in-step across the population in a quantitative manner, this may not be the case. Phenotypic segregation alone does not allow us to model the segregation of the underlying genetic determinants for this CLS resistant trait. Other factors, such as the environment and epistatic mechanisms, can impact the observed variances across a population even in controlled environments such as greenhouse assays (Doust et al., 2014). Therefore, the first steps to uncover whether possible genetics determinants are indeed underpinning this CLS-resistance trait is to look at inheritance. Can the 49 plants that we stringently selected from our greenhouse CLS assay faithfully pass on to the next generation the CLS resistance? If the progeny display the same level of CLS resistance as the phenotypically selected parent, then this would be strong evidence of genetic control, and it is heritable. Because both parental lines in this study were homozygous for self-fertility (SF), each individual plant of the 49 plants that we selected was self-fertile. We took advantage of this individual self-fertility trait to generate single plant descent progeny families as a way to track the genetics of this CLS resistance to the next filial generation.
Therefore, we repeated our greenhouse CLS assays on individual plants in the progeny families for both hybrid crosses by testing 12 plants from each progeny family (Tables 3 and 4). We chose this sampling number for two reasons: a) greenhouse capacity constraints limited how many progeny families could screen concurrently, and by using a half flat setup (12 plants) more progeny families could be screened at the same time, and b) based on our stringent selection criteria and single plant descent methodology, we hypothesized (at least for some families) a digital response in the screening—with 12 out of 12 sampled plants per progeny family having more or less the same CLS resistance rating as the KEMS06 parental line.
Beginning with the results from Cross1-F3 (KDH4-9 x KEMS06-F3 progeny) in Table 3, there was a wide spectrum of CLS response in the progeny. To organize these results, we sorted the progeny families by mean disease index (lowest to highest; far right column on Table 3). The results show a distinct segregation of the progeny families based on, not only the mean disease index results, but also by the clustering pattern of the individual plants within each family as visualized in Figure 2A. There was a segregation pattern that can be broadly defined as resistant, segregating, and susceptible. 1) resistant: individual plants in 5 progeny families from Cross1-F3 showed nearly identical disease mean indices (~2.0) as the KEMS06 parent as well as the scores clustering at the low end of the disease rating scale (more resistant). 2) segregating: individual plants in 4 progeny families had mean disease index ratings between 3.7 to 5.0, well above the stringent CLS resistance selection cutoff requirements of less than 2 that was established earlier and displayed an evenly distributed segregation pattern of the CLS trait from the low end of the disease rating scale to the high end of the disease rating scale. 3) susceptible: individual plants in the last 3 progeny families were quite susceptible with mean disease index ratings between 7.9-8.0 indicating that CLS resistance was not inherited from the previous filial generation. In fact, all three of these progeny families showed a level of susceptibility very similar to the selected susceptible progeny line at the bottom of the list on Table 3. A similar pattern emerged for the Cross2-F4 (KDH13 x KEMS06-F4) progeny families which could also be organized by sorting the mean disease index (lowest to highest; far right column on Table 4) and the clustering pattern of the individual plants within each family (Figure 3A). There were six Cross2-F4 progeny families that could be grouped into the resistant category; 7 progeny families that could be grouped into segregating
When the Cross1-F2 and Cross2-F3 progeny were tested in the greenhouse for CLS resistance, the individual plants always remained within their families, and it was the collective families that were sorted based on the three groups discussed: resistant, segregating, and susceptible group. However, sugar beet crop domestication is still considered to be in its infancy, so it is not uncommon to find breeding ‘families’ to be segregating for challenging reproductive traits such as genetic male sterility or self-incompatibility traits (Panella and Lewellen, 2007). This is especially true when broadening the genetic base of breeding lines with wild beets accessions that naturally have these reproductive traits to promote outcrossing within a population to maintain genetic diversity (Panella and Lewellen, 2007). Therefore, it is important to discuss recurrent selection breeding which would have resulted in equally successful outcomes to single plant descent breeding, but usually requires additional generations to arrive at complete introgression of the desired trait (Panella and Lewellen 2007; Karakotov et al., 2021). Recurrent selection breeding method focuses on pooling phenotypically selected plants together as a group then bulk cross-pollinating together with repeated selection/generation cycles until complete introgression of the desired trait is achieved (Panella and Lewellen 2007; Karakotov et al., 2021). As mentioned above, sometimes this is required if the population is segregating for reproductive deficits that prevents the use of single plant descent/self-fertilization.
For an approximated recurrent selection outcome in these experiments, if our phenotypic selection criteria that we used in the greenhouse CLS assay was at a high level to give us confidence that we were enriching for the trait then all selected individual plants could have been combined to generate a bulk seed production on the selected plants (bulk the 16 plants together for Cross1-F2 and bulk the 33 plants together for Cross2-F3). The individual plant progeny within each bulk seed production would have then been scored for CLS response resulting in the unsegregated progeny analysis for both Cross1-F3 and Cross2-F4 as shown in Figures 2C and 3C, respectively. While the number of plants that scored 2 or lower (more resistant) on the CLS rating scale increased, a recurrent selection method would have required additional generations to reach full introgression of the CLS resistance trait.
Heritability of the CLS resistance trait is one of the most important results from the greenhouse testing of the progeny families. This is clearly seen in the resistant category. Five out of 11 families (45%) from Cross1-F3 and 6 out of 16 families (38%) from Cross2-F4 showed that the KEMS06 CLS resistance trait was fully introgressed and fixed—fixed as defined as all individual plants within a single progeny family displaying the same KEMS06 CLS resistance trait without a broad segregating distribution (Figures 2B and 3B). Progeny testing in the greenhouse further refined our selection of families to move forward with in the breeding pipeline by selecting the top 11 progeny families that had nearly identical disease mean indices (~2.0) as the KEMS06 parent as well as having a similar score clustering at disease resistant end of the rating scale.
In our pre-breeding pipeline, we intentionally switched from bulk seed production that was done during pre-phenotypic selection of the segregating population to single plant selfing seed production post-phenotypic selection so that if our phenotypic selection was stringent enough, some or all of the progeny families would be fixed for the desired CLS resistance trait. This outcome is only possible by starting with two parental lines homozygous for self-fertility so that all plants that were phenotypically selected (above cutoff 2 on the disease rating scale) in the segregating filial generation would be guaranteed to be fertile when bolting commenced four months later.
If homozygous self-fertile parental lines had not been utilized and were segregating for male sterility, then there would have been a 1:3 to 1:9 chance that the plants being phenotypically selected for CLS resistance may also have been phenotypically pollen sterile preventing self-fertilization and the lineage from that single plant would have ended—unable to capture the fixed CLS resistance trait for the next generation. The breeding work-around often used for this is to cross-pollinate sterile or self-incompatible siblings (when identified) to one of the cohorts that are pollen fertile (sib-mating). In our case, other plants in the same CLS resistant selection cohort that are pollen fertile would be the pollen donors to other cohorts that are pollen sterile (or self-incompatible). The downside to sib-mating is that even with stringent selection criteria that we used, the progeny could still be segregating for the CLS resistance trait resulting in a sibling pair that would keep an exchange of genetic diversity within the population, but not be fixed for the disease resistance trait. This would require a second round of phenotypic selection in the following (F4 or F5) generations and possibly running again into male sterile cohorts.
It is important to note that the hypocotyl color (red or green) and seed germ-type (monogerm or multigerm) traits that were used to verify that we had successfully generated our hybrid Cross1 and Cross2 are still segregating in the successive filial generations (F3 for Cross1 and F4 for Cross2) as shown in Table 5. These visual markers will continue to be used for successive backcrossing/introgressing experiments in our pre-breeding pipeline. In addition, when this Cercospora resistant pre-breeding line is released, seed breeders can use these visual traits for increased flexibility in their breeding pipelines as well.
Summary
In this report we describe the use of greenhouse CLS assays to characterize a CLS resistance trait from the KEMS06 sugar beet germplasm. Within two different hybrid populations derived from KEMS06 (Cross1 and Cross2), the measured segregation patterns with corresponding variance scores strongly suggest that there are genetic determinants directly linked to the CLS resistance trait and are segregating in-step across the population in a quantitative manner. Heritability of the KEMS06 CLS resistance trait was tractable into the F2, F3, and F4 filial generations as demonstrated by our greenhouse CLS assay. By following a single plant descent methodology—expedited by the use of self-fertility traits in the parental lines—complete introgression was observed in the progeny families.
To make this CLS resistance trait as translatable as possible to the sugar beet research community as a whole, we are also pursuing this trait at the molecular level in order to elucidate the genetic underpinnings in the sugar beet genome. By using the double haploid parental lines (KDH4-9 and KDH13) in this study, we are establishing a genomic framework for us to genetically track any causal variants linked to the observed phenotypes in genome-wide association studies (GWAS). This work also is expected to facilitate the identification of tractable molecular markers for marker assisted selection (MAS) breeding approaches to expedite the introgression of the CLS resistance trait into other sugar beet breeding lines for research and commercial purposes.
The utility of pre-breeding pipelines for sugar beet development
While the primary focus of this study was to investigate the possible genetic underpinnings to the KEMS06 CLS resistance trait using greenhouse amendable methods and assays, there are some general guidelines that we have found that are applicable to many other sugar beet pre-breeding initiatives with similar goals to identify new and novel causal variants to other disease resistant traits (e.g. Curly top virus or Rhizoctonia root and crown rot), or other goals such as the introgression of wild beet relatives or mutagenized populations for germplasm enrichment purposes. None of the methods below are new and novel per se but by combining them together—a pre-breeding pipeline emerges. Collectively, the methods described within this report accelerated our CLS resistance pre-breeding timeline by reducing the time that would normally be required to introgress and fix disease resistance traits if limited to field trials and recurrent selection methods only. The three general guidelines for our greenhouse pre-breeding pipeline in selecting for CLS resistance and progressing in our pre-breeding pipeline are outlined below and illustrated in the flowchart on Figure 4:
- Using Individual plant selections to phenotypically ‘sieve through’ segregating populations: It is important to select parental lines that are sufficiently resistant/susceptible across the disease spectrum being studied as well as establish or adapt disease rating metrics for stringent selection. Hybrid crosses were then brought to phenotypically segregating populations before selecting for the desired traits. In the current study, for Cross1 this was the F2 generation and for Cross2 this was the F3 generation. Once a population is phenotypically segregating, individual plants can then be selected. Since greenhouse screens allow for close inspection of individual plants or even young seedlings, stringent selection can act like a “phenotypic sieve” by finding the needle in a haystack within heterogenous populations or highly segregating populations controlled by polygenic genetic traits. Individual plants if given proper care, can then have swift vernalization turn-around times and bolting within four months. This is in contrast with field selection which is usually a once-a-season turnaround timeline.
- Greenhouse assays reduce environmental stress and confounding observations: Pre-breeding brings unique challenges that greenhouse assays can overcome. This includes working with wild beet relatives and mutagenized populations that often lack sufficient agronomic traits for general field trials—such as uniform germination or early seedling vigor. In the field, the lack of these agronomic traits could substantially reduce uniform field plot establishment complicating evaluation and selection. A well-developed greenhouse assay can uncouple some of these field-desired agronomic traits without affecting the screening for disease resistance. An example of this would be to germinate under filter paper and transplant only germinated seedlings to the greenhouse for disease rating assays. Furthermore, selecting individual plants with resistance out of heterogenous breeding populations in the field is difficult because of the masking effects from environmental and nutritional factors (Doust et al., 2014)—both of which can be tightly controlled in the greenhouse.
3. Leveraging self-fertility to fix a desired trait in the progeny: When establishing this pre-breeding pipeline study, we wanted to, as quickly as possible, fix the target trait in the progeny as soon as the phenotyping selections were made. Single seed/plant descent post-phenotypic selection is the most straightforward method in achieving this goal, especially if the selected plants are capable of self-fertilization. However, self-fertilization is a double-edged sword with modern sugar beet breeding programs. On one hand, it is not possible to generate hybrid sugar beet seed on a commercial scale without eliminating self-fertility from the final crosses. But on the other hand, in pre-breeding pipelines such as the one we are reporting here, self-fertility allows immediate single seed/plant descent as soon as phenotypic selections are made—rapidly fixing desired traits that can be verified in the progeny lines. We do believe that both can and should co-exist, but that in pre-breeding pipelines, self-pollination should be used as much as possible.


Literature Cited:
Atoum Y., M.J. Afridi, X. Liu, J.M. McGrath, and L.E. Hanson. 2016. On developing and enhancing plant-level disease rating systems in real fields. Pattern Recognit. 53:287-299. https://doi.org/10.1016/j.patcog.2015.11.021
Baenziger P.S. 1996. Reflections on double haploids in plant breeding. p. 35-48. In S.M. Jain, S.K. Sopory, R.E. Veilleux (eds.). In Vitro Haploid Production in Higher Plants. Current Plant Science and Biotechnology in Agriculture. Springer, Dordrecht. The Netherlands. https://doi.org/10.1007/978-94-017-1860-8_3
Bernardo, R. 2020. Reinventing quantitative genetics for plant breeding: something old, something new, something borrowed, something BLUE. Heredity. 125:375-385. https://doi.org/10.1038/s41437-020-0312-1
Brown J.K.M.. Yield penalties of disease resistance in crops. 2002. Curr. Opin. Plant Biol. 5:339-344. https://10.1016/s1369-5266(02)00270-4
Doust, A.N., L. Lukens, K.M. Olsen, M. Mauro-Herrera, A. Meyer, and K. Rogers. 2014. Beyond the single gene: How epistasis and gene-by-environment effects influence crop domestication. Proc. Natl. Acad. Sci. U.S.A. 11:6178-6183. https://doi.org/10.1073/pnas.1308940110
El-Jarroudi, M., F. Chairi, L. Kouadio, K. Antoons, A.-H.M., Sallah, A.-H.M.; X. Fettweis. 2021. Weather-based predictive modeling of Cercospora beticola infection events in sugar beet in belgium. J. Fungi. 7:777. https://doi.org/10.3390/jof7090777
Emam, M.A.I., N.A. Ghazy, M.M. Labib, A.M.A El-Mageed, and S.A. Mahmoud. 2022. Determintion the genetic resistance of Cercospora leaf spot disease in some sugar beet cultivars using agronomic traits and molecular markers by start codon targeted (sCoTs). Egypt. J. of Appl. Sci. 37:11-12. https://doi.org/10.21608/EJAS.2022.286596
Eujayl, I.A., and C.A. Strausbaugh. 2014. Beet curly top resistance in USDA-ARS Kimberly sugar beet germplasm, 2013. Plant dis. manag. rep. 8:FC250. https://doi.org/10.1094/PDMR08
Eujayl, I.A., and C.A. Strausbaugh. 2016. Beet curly top resistance in USDA-ARS Kimberly germplasm lines, 2015. Plant dis. manag. rep. 10:FC055. https://doi.org/10/1094/PDMR10
Eujayl, I.A., C.A. Strausbaugh, and C. Lu. 2016. Registration of sugar beet doubled haploid line KDH13 with resistance to beet curly top. J. Plant Regist. 10:93-96. https://doi.org/10.3198/jpr2015.09.0055crgs
Eujayl, I.A., and C.A. Strausbaugh. 2018. Kimberly sugar beet germplasm evaluated for rhizomania and storage rot resistance in Idaho, 2017. Plant dis. manag. rep. 12:CF153. https://doi.org/10.1094/PDMR12
Eujayl, I.A., E.D. Vincill, C.A. Strausbaugh, and L.E. Hanson. 2022. Beta vulgaris lines from USDA-ARS Kimberly evaluated for resistance to Cercospora beticola, 2015. Plant dis. manag. rep. 16:V134. https://doi.org/10.1094/PDMR16
Eujayl, I.A., E.D. Vincill, C.A. Strausbaugh, and L.E. Hanson. 2022. Beta vulgaris lines from USDA-ARS Kimberly evaluated for resistance to Cercospora beticola, 2016. Plant dis. manag. rep. 16:V135. https://doi.org/10.1094/PDMR16
Gummert A., E. Ladewig, K. Bürcky, and B. Märländer. 2015. Variety resistance to Cercospora leaf spot and fungicide application as tools of integrated pest management in sugar beet cultivation—A German case study. Crop Prot. 72:182-194. https://doi.org/10.1016/j.cropro.2015.02.024
Gurel S, A. Pazuki, F. Aflaki, E. Gurel. 2021. Production of double haploid sugar beet (Beta vulgaris L.) plants through gynogenesis. Methods Mol. Biol. 2289:313-323. https://doi.org/10.1007/978-1-0716-1331-3_21
Hanson L., T. Goodwill, and J. McGrath. 2014. Beta PIs from the USDA-ARS NPGS evaluated for resistance to Cercospora beticola, 2013. Plant dis. manag. rep. 8:FC17 https://doi.org/10.1094/PDMR08
Hernandez A.P., D.M. Bublitz, T.J. Wenzel, S.K. Ruth, C. Bloomingdale, D.C. Mettler, M.W. Bloomquist, L. E. Hanson, and J.F Willbur. 2023. An in-field heat treatment to reduce Cercospora beticola survival in plant residue and improve Cercospora leaf spot management in sugarbeet. Front. Plant. Sci. 14:2030. https://doi.org/10.3389/fpls.2023.1100595
Jansen M., S. Bergsträsser, S. Schmittgen, M. Müller-Linow, U. Rascher. 2014. Non-Invasive Spectral Phenotyping Methods can Improve and Accelerate Cercospora Disease Scoring in Sugar Beet Breeding. Agriculture. 4:147-158. https://doi.org/10.3390/agriculture4020147
Jay S., A. Comar, R. Benicio, J. Beauvois, D. Dutartre, G. Daubige, W. Li, J. Labrosse, S. Thomas, N. Henry, M. Weiss, F. Baret. 2020. Scoring Cercospora leaf spot on sugar beet: Comparison of UGV and UAV phenotyping systems. Plant Phenomics. 2020:9452123. https://doi.org/10.34133/2020/9452123
Karakotov S.D., I.V. Apasov, A.A. Nalbandyan, E.N. Vasilchenko, T.P. Fedulova. 2021. Modern issues of sugar beet (Beta vulgaris L.) hybrid breeding. Vavilovskii Zhurnal Genet Selecktsii. 25:394-400. https://doi.org/10.18699/vjgb-23-39
Khan J., A. Qi, and M.F.R. Khan. 2009. Fluctuations in Number of Cercospora beticola Conidia in Relationship to Environment and Disease Severity in Sugar Beet. Phytopathology. 99:796-801. https://doi.org/10.1094/PHYTO-99-7-0796
Khan J., L.E.D. Río, R. Nelson, and M.F.R. Khan. 2007. Improving the Cercospora leaf spot prediction model for sugar beet in Minnesota and North Dakota. Plant Dis. 91:1105-1108. https://doi:10.1094/PDIS-91-9-1105
Khan J., L.E.D. Rio, R. Nelson, V. Rivera-Varas, G. A. Secor, and M.F.R. Khan. 2008. Survival, Dispersal, and Primary Infection Site for Cercospora beticola in Sugar Beet. Plant Dis. 92:741-745. https://doi.org/10.1094/PDIS-92-5-0741
Kiniec A., J. Piszczek, W. Miziniak, and A. Sitarski. 2020. Impact of the variety and severity of Cercospora beticola infection on the qualitative and quantitative parameters of sugar beet yields. Polish J. Agron. 41:29–37.
https://doi.org/10.26114/pja.iung.410.2020.41.04
Louwaars, N.P. 2018. Plant breeding and diversity: A troubled relationship?. Euphytica. 214:114. https://doi.org/10.1007/s10681-018-2192-5
Liu Y., L.E. del Rio Mendoza, A. Qi, D. Lashman, M.Z.R Bhuyian, N. Wyatt, J. Neubauer, M. Bolton, and M.F. Khan. 2023. Resistance to QoI and DMI fungicides do not reduce virulence of C. beticola isolates in North Central USA. Plant Dis. 107:2825-2829. https://doi.org/10.1094/PDIS-11-21-2583-RE
Majumdar, R., I.A. Eujayl, and C.A. Strausbaugh. 2023. Kimberly sugar beet germplasm evaluated for rhizomania and storage rot resistance in Idaho, 2022. Plant dis. manag. rep. 17:V138. https://doi.org/10.1094/PDMR17
Memic E, S. Graeff-Hönninger, O. Hensel, and W.D. Batchelor. 2020. Extending the CSM-CERES-beet model to simulate impact of observed leaf disease damage on sugar beet yield. Agronomy. 10:1930. https://doi.org/10.3390/agronomy10121930
Misra V., R.J. Lak, A.K. Mall, S. Srivastava, and A. Baitha. 2022. Integrated disease management in sugar beet for sustainable productivity. p. 607-619. In V. Misra, S. Srivastava, A.K. Mall (eds.). Sugar Beet Cultivation, Management and Processing. Springer, Singapore. https://doi.org/10.1007/978-981-19-2730-0
Panella L., and R.T. Lewellen. 2007. Broadening the genetic base of sugar beet: introgression from wild relative. Euphytica. 154:383-400. https://doi.org/10.1007/s10681-006-9209-1
Rangel L.I., R.E. Spanner, M.K. Ebert, S.J. Pethybridge, E.H. Stukenbrock, R. de Jonge, G.A. Secor, M.D. Bolton. 2020. Cercospora beticola: The intoxicating lifestyle of the leaf spot pathogen of sugar beet. Mol. Plant Pathol. 21:1020–1041. https://doi.org/10.1111/mpp.12962
Rossi V., P. Battilani, G. Chiusa, S. Giosue, L. Languasco, P. Racca. 1999. Components of rate-reducing resistance to Cercospora leaf spot in sugar beet: Incubation length, infection efficiency, lesion size. J. Plant Pathol. 81:25-35. https://www.jstor.org/stable/41997938
Rossi V., P. Battilani, G. Chiusa, S. Giosue, L. Languasco, P. Racca. 2000. Components of rate-reducing resistance to Cercospora leaf spot in sugar beet: Condiation length, spore yield. J. Plant Pathol. 82:125-131. https://www.jstor.org/stable/41997992
Ruppel E.G., and J.O. Gaskill. Techniques for evaluating sugarbeet for resistance to Cercospora beticola in the field. 1971. J. Am. Soc. Sugar Beet Technol. 16:384-389. https://doi.org/10.5274/JSBR.16.5.384
Shane W.W., and P.S. Teng. 1992. Impact of Cercospora leaf spot on root weight, sugar yield, and purity of Beta vulgaris. Plant Dis. 76:812-820 https://doi.org/10.1094/PD-76-0812
Skaracis G.N., O.I. Pavli, and E. Biancardi. 2010. Cercospora leaf spot disease of sugar beet. Sugar Tech. 12:220-228. https://doi.org/10.1007/s12355-010-0055-z
Song, H., G. Ding, C. Zhao, and Y. Li. Genome-wide identification of B-box gene family and expression analysis suggest its roles in response to Cercospora leaf spot in sugar beet (Beta vulgaris L.). 2023. Genes. 14:1248. https://doi.org/10.3390/genes14061248
Spanner R., J. Neubauer, T.M. Heick, M.A. Grusak, O. Hamilton, V. Rivera-Varas, R. de-Jonge, S. Pethybridge, K.M. Webb, G. Leubner-Metzger, Gary A. Secor, and M. Bolton. 2022. Seedborne Cercospora beticola can initiate Cercospora leaf spot from sugar beet (Beta vulgaris) fruit tissue. Phytopathology. 112:1016-1028. https://doi.org/10.1094/PHYTO-03-21-0113-R
Taguchi K, Kubo T, Takahashi H, and Abe H. 2011. Identification and precise mapping of resistant QTLs of Cercospora leaf spot resistance in sugar beet (Beta vulgaris L.). G3-Genes|Genomes|Genet. 1:283-291. https://doi.org/10.1534/g3.111.000513
Tan W., K. Li, D. Liu, W. Xing. 2023. Cercospora leaf spot of sugar beet. Plant Signal. and Behav. 18:2214765. https://doi.org/10.1080/15592324.2023.2214765
Vogel J, C. Kenter, C. Hoist, and B. Märländer. 2018. New generation of resistant sugar beet varieties for advanced integrated management of Cercospora leaf spot in Central Europe. Front. Plant Sci. 9:222. https://doi.org/10.3389/fpls.2018.00222
Vyska M., N. Cunniffe, and C. Gilligan. 2016. Trade-off between disease resistance and crop yield: a landscape-scale mathematical modelling perspective. J. R. Soc. Interface. 13:20160451. https://doi.org/10.1098/rsif.2016.0451
Windels C.E, H.A. Lamey, D. Hilde, J. Widner, T. Knudsen. 1998. A Cercospora leaf spot model for sugar beet: In practice by an industry. Plant Dis. 82:716-726. https://doi.org/10.1094/PDIS.1998.82.7.716
Wolf, P.F.J., and J.A. Verreet. Factors affecting the onset of Cercospora leaf spot epidemics in sugar beet and establishment of disease-monitoring thresholds. 2005. Phytopathology. 95:269-274. https://doi.org/10.1094/PHYTO-95-0269
Xu Y. 2016. Envirotyping for deciphering environmental impacts on crop plants. 2016. Theor. Appl. Genet. 129:653-673. https://doi.org/10.1007/s00122-016-2691-5