Growers in the Imperial Valley have adopted glyphosate resistant varieties in their sugar beet production system. One of the advantages of the use of glyphosate resistant varieties is the reduction of the need to cultivate for weed control at layby (November). This cultivation operation at layby was also combined with a split application of nitrogen. The cultivation at layby required that irrigation basins be deconstructed for equipment access to the field and then rebuilt following the cultivation. With the advent of glyphosate resistant varieties, weed control is obtained without cultivating and thus the irrigation basins do not need to be deconstructed. This requires growers to apply their nitrogen fertilizer pre-plant instead of the former practice of split application.
Research Objective
- The objective of this study was to determine the effect of nitrogen rate and timing on sugar beet root yield and quality.
Methodology
The study was established at four locations from 2017 to 2020 in the Imperial Valley of California. The treatments were a factorial combination of eight nitrogen application rates (0, 40, 80, 120, 160, 200, 240, and 280 lbs. N/A) and two application timings (pre-plant and layby). Three of the locations were harvested during the late harvest period (June or July) and one location was harvested during early harvest, Table 1. The data was analyzed with the GLM procedure in SAS. The data for the late harvests were combined for analysis, while the early harvest location was analyzed separately.
Table 1. Soil properties and dates of events for each of the four locations.
| Activity or soil property | 1718-1 IVRC | 1819-1 IVRC | 1819-2 | 1920-1 |
| Soil series | Imperial-Glenbar silty clay loam (wet) | Imperial-Glenbar silty clay loam (wet) | Holtville silty clay (wet) | Imperial silty clay (wet) |
| Variety | SES 2014 | SES 604 | SES 604 | SES 604 |
| Planting | 11/20/2017* | 10/12/2018 | 10/16/2018 | 9/13/2019 |
| Pre-plant fertilizer application | 10/19/2017 | 10/11/2018 | 10/04/2018 | 9/12/2019 |
| Layby fertilizer application | 1/22/2018 | 1/04/2019 | 12/03/2018 | 11/01/2019 |
| Harvest | 6/26/2018 | 6/12/2019 | 6/28/2019 | 4/06/2020 |
| Soil nitrate-N 0-4 ft. (lbs./A) | 71 | 108 | 65 | 282 |
| Olsen-P (ppm) | 22 | 11 | 3 | 15 |
| Soil test K (ppm) | 475 | 530 | 97 | 324 |
* Site replanted because of poor stand.
Results
Late harvest locations
The three late harvest locations were statistically analyzed together, Table 2.
Quality parameters, extractable sucrose per ton and purity, were affected by the N application. Nitrogen fertilizer affected purity differently at each location, Table 2 and Figure 1. The increasing N application rate increased purity up to approximately 150 lbs. N/A and then reduced quality with applications greater than 150 lbs. N/A at the 1718-1 and 1819-2 locations while at the 1718-2 location the addition of N reduced purity at all N application rates, Figure 1.
Extractable sucrose per ton was reduced by all application rates of N similarly at all locations, Figure 1. The reduction was about 20 lbs. extractable sucrose/A with 280 lbs. N/A applied treatment.
Root yield and extractable sucrose per A were affected by N rate and location, Table 2. There was also a N rate by Location interaction. The interaction was caused by differing magnitudes of positive response of root yield and extractable sucrose per A to N rate at each location, Figure 2. The root yield and extractable sucrose per A response to N application increased linearly at the 1819-1 location while the response was curvilinear at locations 1718-1 and 1819-2. On the average, N application increased root yield 14 T/A with an optimum around 240 lbs. N/A. Extractable sucrose per A was increased 2000 lbs/A by N application with an optimum at 160 lbs. N/A applied.
The time of N application did not affect any of the parameters measured at the late harvested locations.
The optimum application rates were in line with the current fertilizer N plus residual soil nitrate-N recommendation of 250 lbs. N/A in the Imperial Valley of California.
Table 2. The combined statistical analysis of the late harvested locations, 1718-1, 1819-1, and 1819-2, for root yield, extractable sucrose per T, extractable sucrose per A, purity, and petiole nitrate-N.
| Source of variation | Extractable sucrose per T | Purity | Root yield | Extractable sucrose per A |
| ———————————————- P>F ———————————————- | ||||
| Location | 0.0001 | 0.0001 | 0.0001 | 0.0001 |
| N rate | 0.0004 | 0.004 | 0.0001 | 0.0009 |
| N rate*Location | NS | 0.08 | 0.08 | 0.08 |
| N rate*Timing | NS | NS | NS | 0.07 |
| Timing | NS | NS | NS | NS |
| Timing*Location | NS | NS | NS | NS |
| Nrate*Timing*Location | NS | NS | NS | NS |
| C.V. (%) | 4.2 | 1.1 | 7.7 | 7.5 |
| Grand mean | 270 lbs./T | 88.7 % | 58.2 T/A | 15739 lbs./A |
NS = not significant at > 0.10
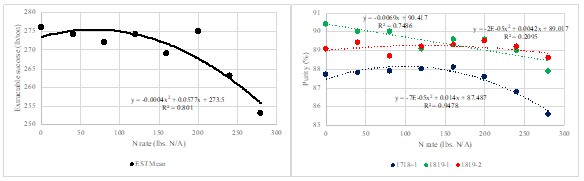
Figure 1. The effect of N fertilizer and time of application on extractable sucrose per T and root purity at the late harvested locations, 1718-1, 1819-1, and 1819-2.
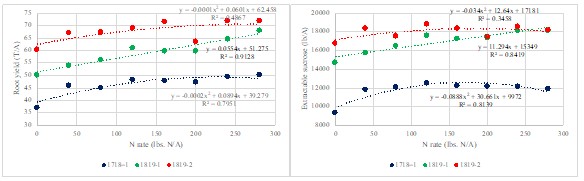
Figure 2. The effect of N fertilizer on root yield and extractable sucrose per A at the late harvested locations, 1718-1, 1819-1, and 1819-2.
Early harvest location
Location 1920-1 was analyzed separately from the rest as it was harvested at least two months earlier and there was systematic variability in top growth at the location. The top growth was evaluated and used as a covariate in the statistical analysis at this location. The residual soil nitrate-N for this location was significantly greater than the rest of the locations, Table 1. Nitrogen rate and time of application significantly affected the extractable sucrose per T and purity at this location, Table 3. Extractable sucrose was affected by an interaction between the N rate and time of application, Figure 3. The application of N reduced the extractable sucrose per T at both times of application, but the layby application time had a more negative effect on extractable sucrose per T than the pre-plant application. Purity was affected by both N application and the application time, Figure 3. As N rate increased the purity decreased and the purity was decreased more by the layby application when compared to the pre-plant application, Figure 3.
Root yield was increased with the application of N, Table 3 and Figure 4. The timing of application did not affect root yield, Figure 4. The optimum root yield was obtained with the application of 240 lbs. N/A. Extractable sucrose per A was affected by an interaction between N rate and application time, Table 3, Figure 4. While the interaction significance was not particularly strong, the graph in Figure 4 would suggest it has meaning. The extractable sucrose per A for the pre-plant application increased up to 240 lbs. N/A while the response of extractable sucrose per A for plants treated with N at layby had an optimum at 120 lbs. N/A. This optimum was 300 to 400 lbs. sucrose/A less than the plots with N applied at pre-plant. This can be attributed to the effect of N application at layby compared to pre-plant on extractable sucrose per T.
Table 3. The statistical analysis for the early harvested location, 1920-1 for root yield, extractable sucrose per T, extractable sucrose per A, and purity.
| Source of variation | Extractable sucrose per T | Purity | Root yield | Extractable sucrose per A |
| ———————————————- P>F ———————————————- | ||||
| Covariate (top growth) | NS | 0.007 | 0.0001 | 0.0001 |
| N rate | 0.005 | 0.03 | 0.0009 | NS |
| Timing | 0.008 | 0.005 | NS | 0.03 |
| N rate*Timing | 0.10 | NS | NS | 0.11 |
| C.V. (%) | 6.5 | 1.1 | 7.4 | 10.2 |
| Grand mean | 262 lbs./T | 88.4 % | 38.8 T/A | 10119 lbs./A |
NS = not significant at > 0.11.
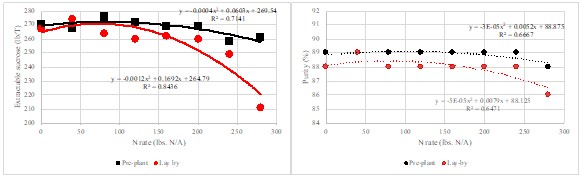
Figure 3. The effect of N fertilizer on extractable sucrose per ton and root purity at the early harvested location, 1920-1.
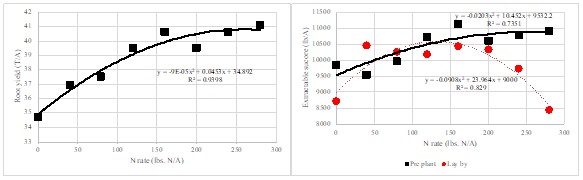
Figure 4. The effect of N fertilizer on root yield and extractable sucrose per A at the early harvested location, 1920-1.
Conclusions
This study gave some insights to the effect of nitrogen rate and timing on sugar beet root yield and quality. Sugar beet yield at all locations responded positively to the application of N fertilizer. The extractable sucrose per T and purity were reduced with N application at all locations and at all N application times.
At the late harvest locations, the time of N application did not affect the extractable sucrose per A while at the one early harvest location the layby application decreased the extractable sucrose per A compared to the pre-plant application. Overall, a pre-plant application is as good or better for sugar beet production as the layby application time in the Imperial Valley of California. This was surprising as these soils have little organic matter (0.5%) and the crop was grown over a period of 9 to 10 months.