1 Introduction
Sugarbeet production in the Northwest U.S. is located primarily in southern Idaho and southeastern Oregon. Sugarbeet growers produce beets for the Amalgamated Sugar Company (ASCO), a grower-owned cooperative. From 2017 to 2021 an average of 67,340 ha yr-1 (166,400 ac yr-1) of sugarbeets were harvested in this growing area (USDA-NASS, 2022). Annually, ASCO grows between 30 and 40% of total U.S. sugarbeet production (USDA-NASS, 2022).
During sugarbeet processing, large amounts of precipitated calcium carbonate (PCC) is produced as the by-product from impurity removal during the purification of the sucrose juice stream. Impurities that need to be removed include organic molecules, phosphorus, magnesium, calcium, potassium and sodium (Hergert et al. 2017). To remove these impurities from the sucrose liquid juice stream, calcium oxide and carbon dioxide are added to form calcium carbonate (CaCO3) which then precipitates out of the liquid juice stream with the impurities included. This combination of CaCO3 and impurities form the PCC which is removed as a solid material and stored on site in large stockpiles.
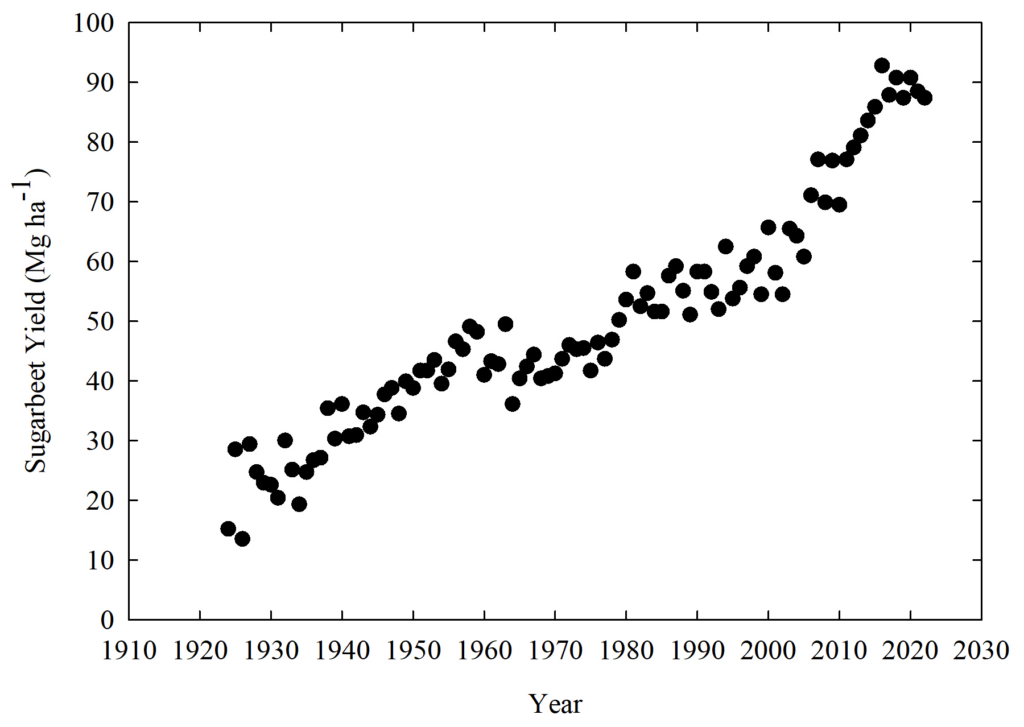
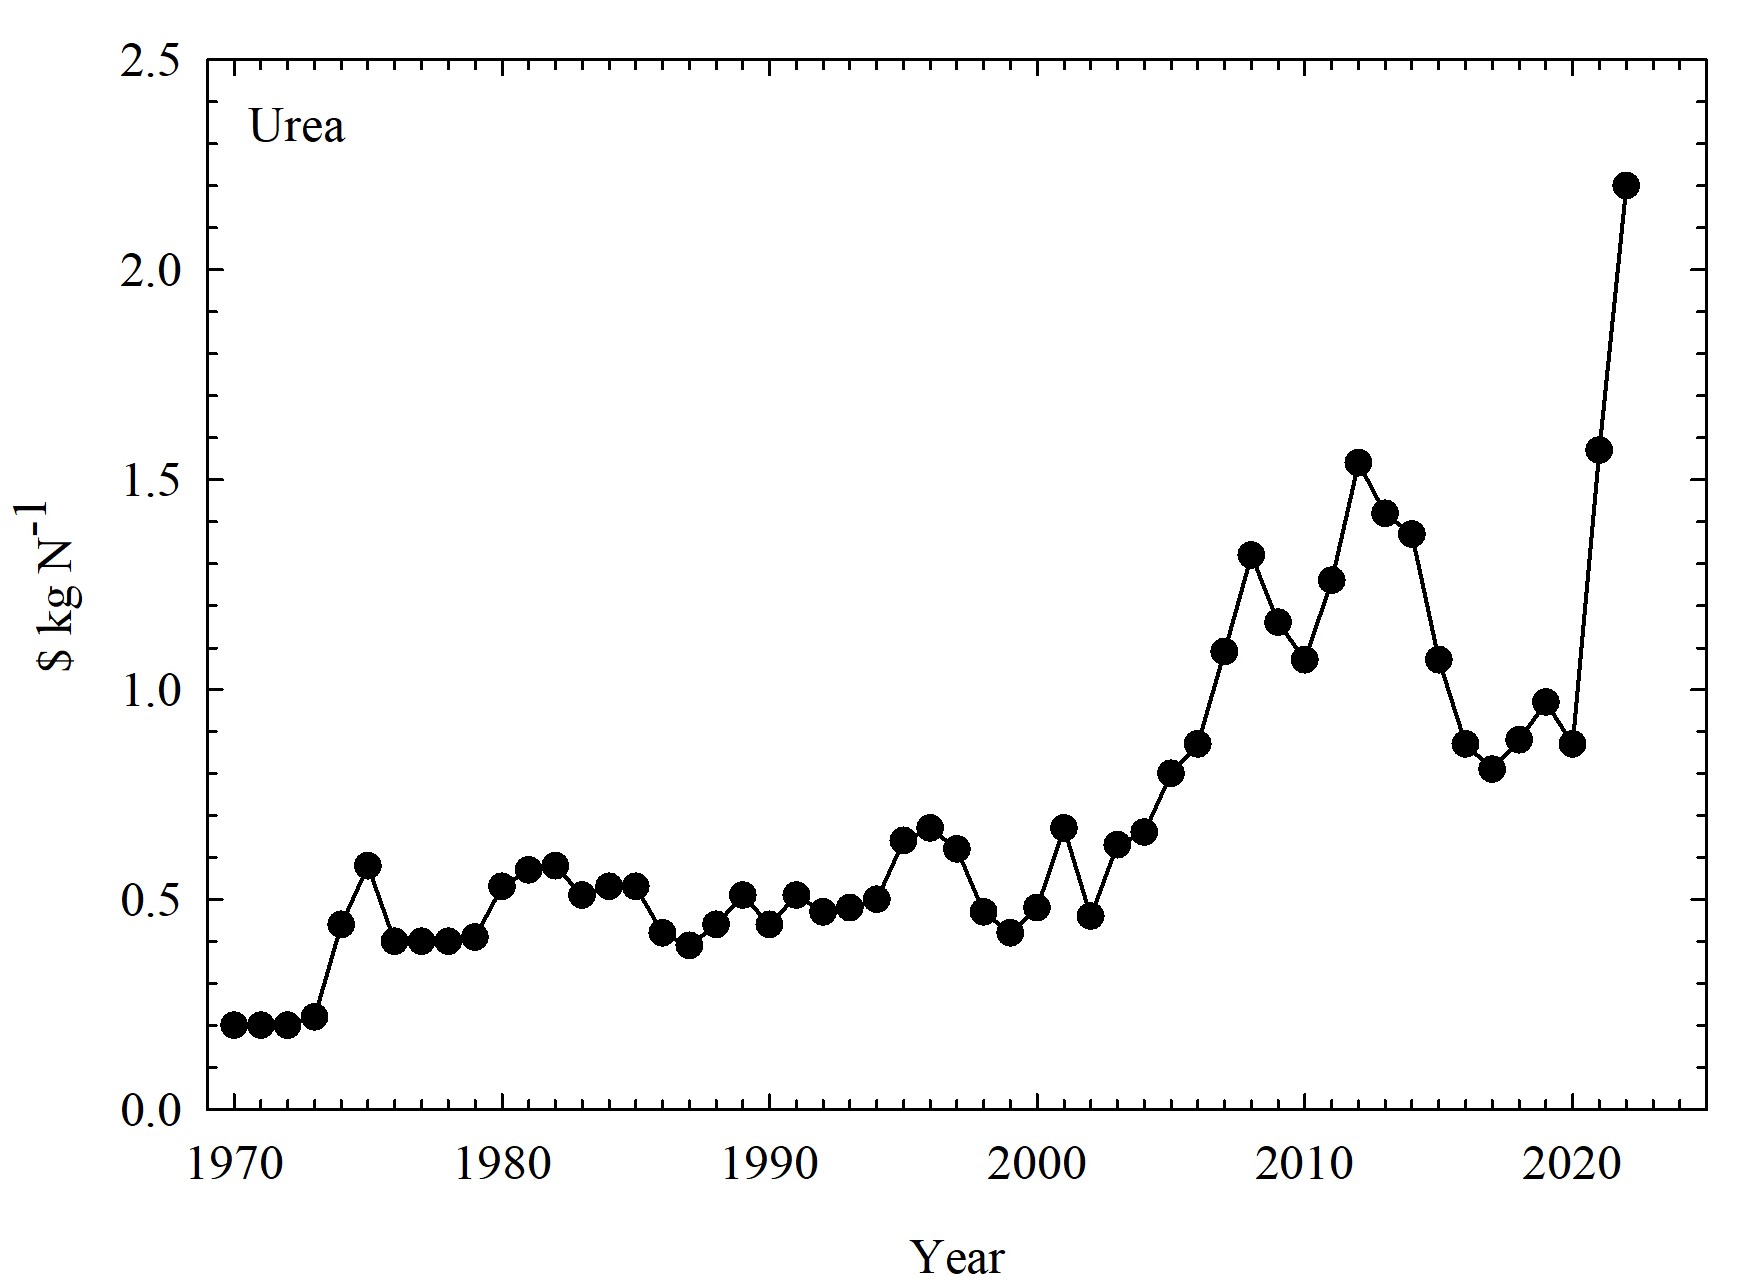
The phosphorus (P) concentrations in PCC are high relative to other nutrients [potassium (K) and zinc (Zn)]. Across sugarbeet production areas in the U.S. P concentrations in PCC ranged from 24 to 34 kg P2O5 ha-1 (21 to 30 lbs P2O5 ac-1), 2.7 to 5.2 kg K2O ha-1 (2.4 to 4.6 lbs K2O ac-1), and 0.08 to 0.10 kg Zn ha-1 (0.07 to 0.09 lbs Zn ac-1), respectively (Table 1). The P, K, Zn and other elements in PCC originate from the sugarbeet root and are extracted along with other non-sucrose constituents in the sugar juice stream (Sailsbery & Hills, 1987). Past studies have reported sugarbeet root P and K concentrations ranging from 200 to 1700 mg P kg-1 and 1700 to 7900 mg K kg-1 (Soine, 1968; Hlisnikovský et al., 2021; Bravo et al., 1989; Carter, 1986; Dudley and Powers, 1960; Doxtator & Calton, 1951). The relatively high concentrations of P in PCC, together with its low cost to the grower, make this product an attractive alternative to fertilizer P, particularly as the price of fertilizer P continues to rise (Figure 1). The prices of fertilizer reached a historic high in 2022 due to increases in the cost of natural gas and transportation (Figure 1) (Smith, 2022).
In 2018, the ASCO processing factories (Paul, ID; Twin Falls, ID; and Nampa, ID) had PCC stockpiles totaling approximately 12.6 million tons. These factories produce approximately 351,081 Mg (387,000 tons) of PCC annually (ASCO, personal communication). Calcium carbonate is not a recommended amendment for the high pH soils in the growing area resulting in PCC being stockpiled. Without an offsite beneficial use or disposal method these stockpiles will continue to grow. The difficulty in finding more land to stockpile PCC and potential environmental issues have resulted in the need for ASCO to prioritize finding uses for this product. Agricultural land application may be a practical method to dispose the PCC. Research conducted in southern Idaho demonstrated that PCC applications did not negatively affect sugarbeet, spring malt barley, or dry bean yields (Tarkalson et al, 2022). Other research has shown that PCC does not negatively affect crop growth and yield (Christenson et al., 2000). The PCC used in the study did not add significant amounts of heavy metals or other harmful constituents and did not increase the soil pH. The overall conclusion from Tarkalson et al. 2022 was that PCC applied to a calcareous silt loam soil in southern Idaho at rates up to 90 Mg ha-1 (40 tons ac-1) did not negatively affect crop production and could serve as a P source. Other research has shown that PCC applications did not negatively affect soil chemistry or crop production (Sailsbery & Hill, 1987; Sims, 2010).
Similar to fertilizer P, applications of PCC can increase soil test P (STP) concentrations (Sims, 2010; Hergert et al., 2017). Modern P fertilizers have been developed to be highly water soluble, and thus plant available, when initially added to soils. However, over time this P will start to react with soil minerals and gradually become less available to plants. In high pH calcareous western U.S. soils, the major P reaction is the formation of calcium phosphates which dominates the soil P cycle. Although PCC is not produced with P solubility as a consideration, PCC does raise STP concentrations, thus increasing plant P availability. Because STP is tied to crop production response, P fertilizer and PCC P economic values can be linked (Sailsbery and Hill, 1987; Sims, 2010). Potassium additions to soil can increase the overall concentrations in soils and contribute to one of the four K pools: mineral, nonexchangeable, exchangeable, and soluble. Although we do not have data on the forms of K in PCC, it is added to these pools which over time will become plant available (exchangeable and soluble) (Tisdale et al.,1993).
The objective of this study was to estimate the P and K fertilizer value of PCC for sugarbeet production in the Northwest U.S. assuming equivalent availability of P and K in PCC to that of P and K in fertilizer.
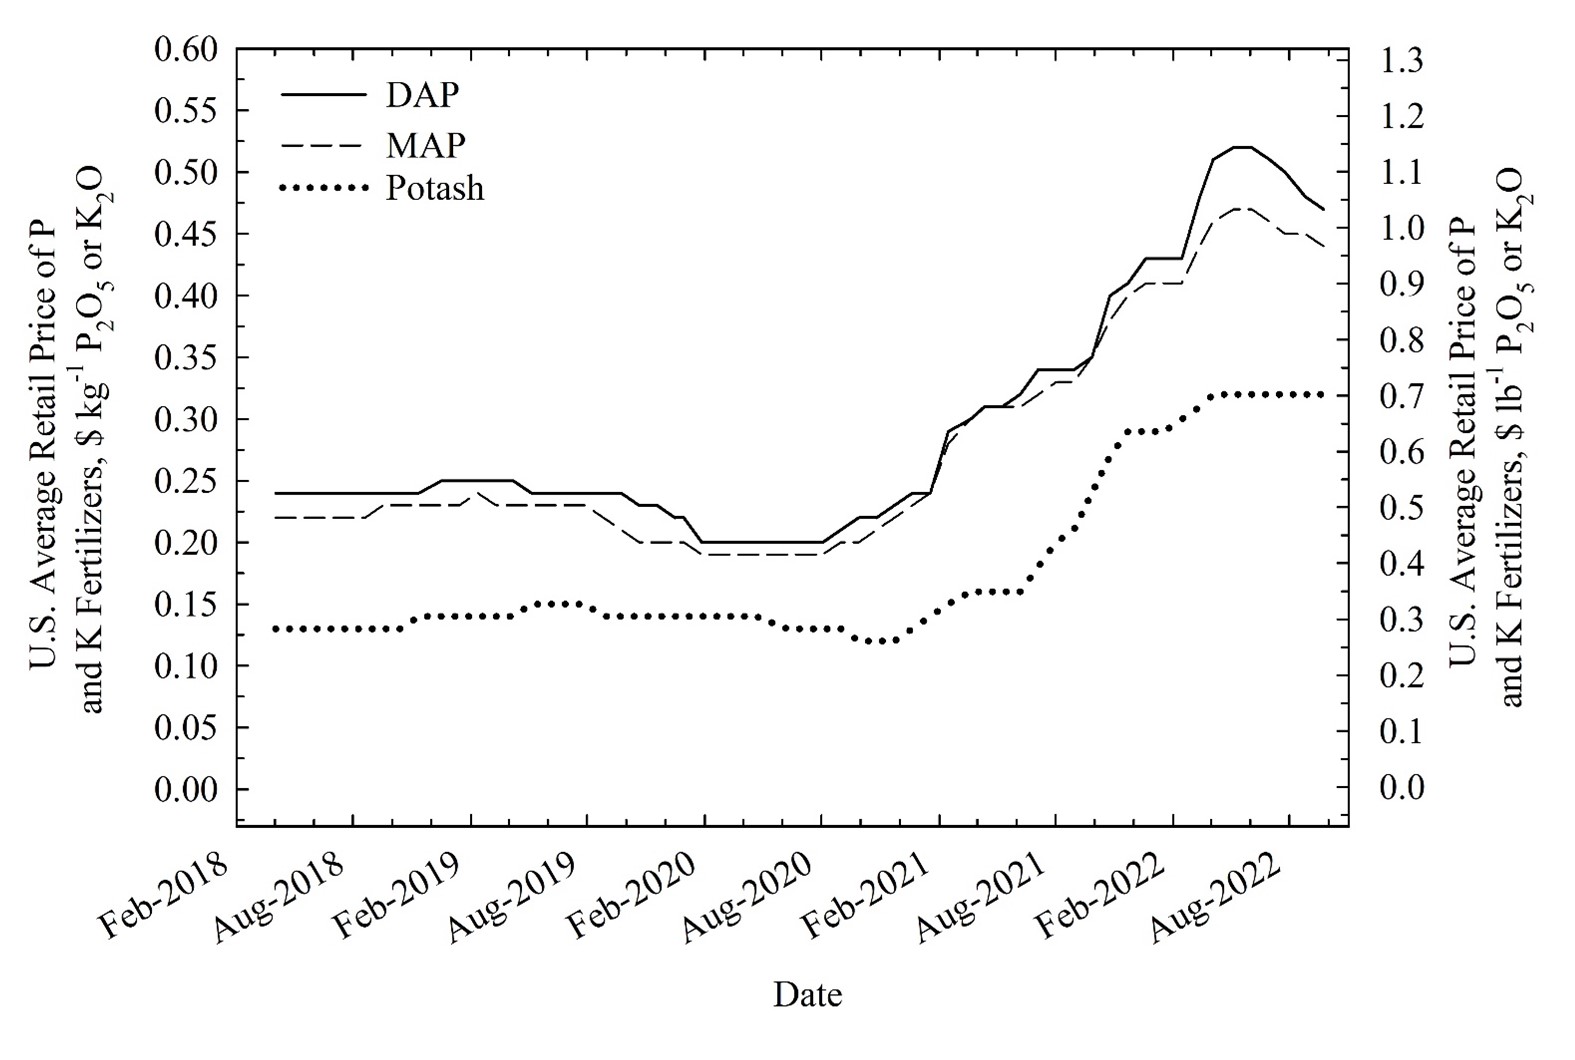
Figure 1. The average U.S. retail P [diammonium phosphate (DAP) and monoammonium phosphate (MAP)] and K (Potash) fertilizer prices (2018-2021). Fertilizer price data from DTN (2022).
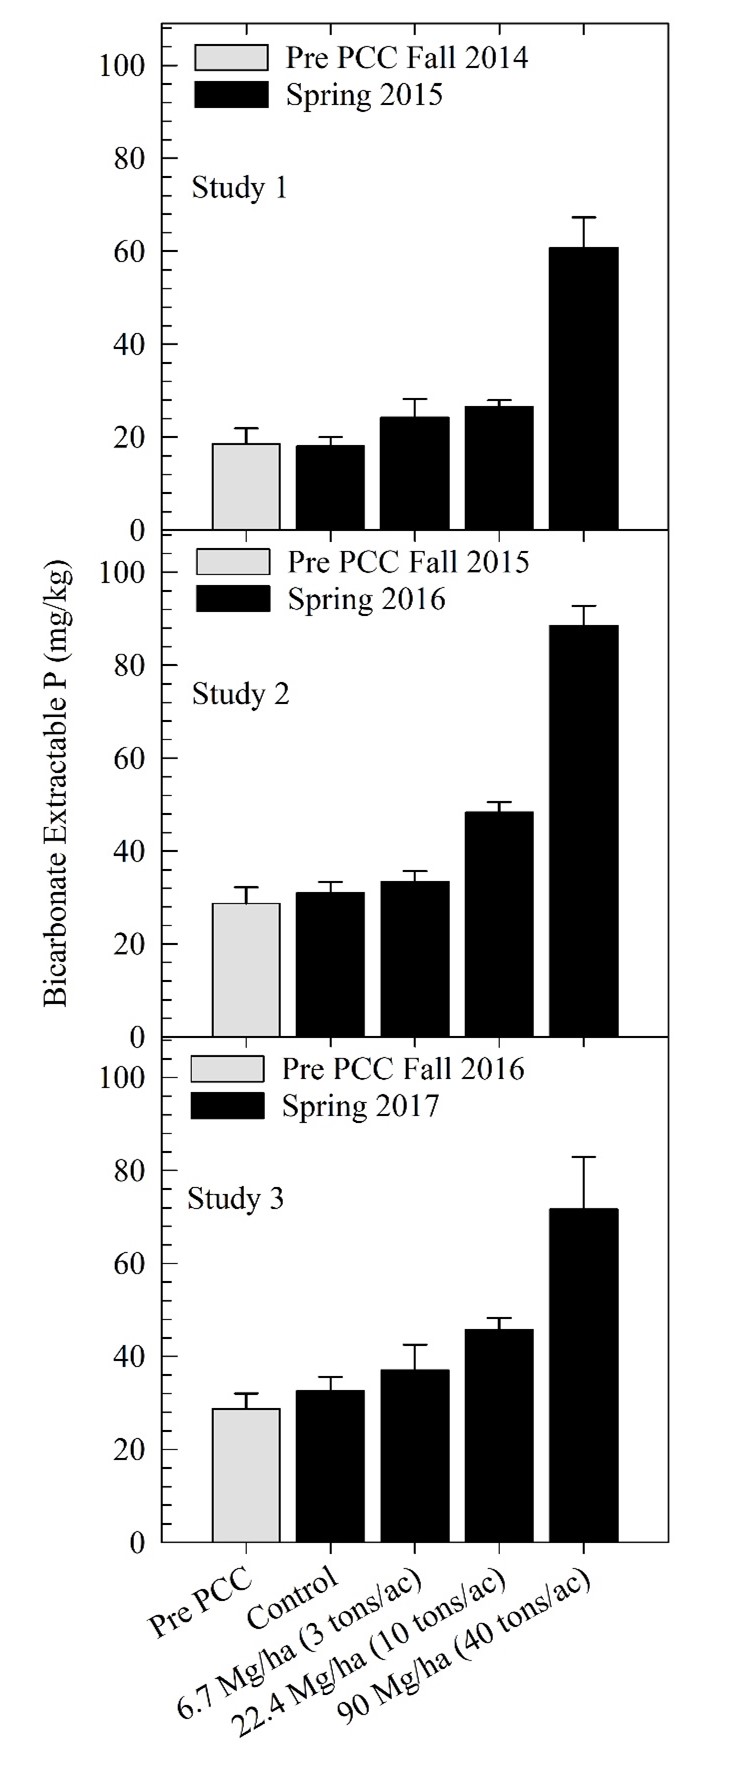
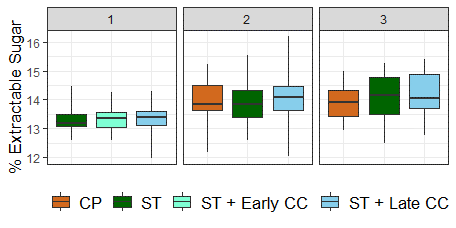
Figure 2. Soil bicarbonate extractable P concentrations for precipitated calcium carbonate (PCC) treatments (PCC applied at 0 tons/ac (control), 3 tons/ac, 10 tons/ac, and 40 tons/ac) in three studies. All application rates are on a dry weight basis. For each study, soil test P concentrations were measured in the 0 to 0.3 m depth in the fall prior to PCC application and the following year in the spring. Error bars are the standard error of the treatment means.
2 MATERIALS AND METHODS
2.1 Agronomic Data
Soil sample analysis and fertilizer data for agricultural land in the Northwest U.S. entering sugarbeet production in 2018, 2019, 2020 and 2021 was collected by ASCO in their AgriData database. Data input was at the field level. For each year, data entered represent fields going into sugarbeet for the next crop. However, all these fields are in a crop rotation with other common crops (e.g. small grain, potato, corn, dry bean). Annually, the approximate number of acres with sugarbeet in a rotation growing other crops is 153,376 ha (379,000 ac). Data were filtered to remove outlier data that potentially were a result of soil test analysis errors or data entry errors (deleted data: soil free lime > 15%, soil pH < 5, soil pH > 8.5, STP = 0 mg kg-1, and soil test K (SPK) = 0 mg kg-1, field ha < 4 (field ac < 10). The ASCO AgriData fields used in the analysis from were crop year, growing district, field ID, acres, soil sample date, soil sample excess lime content, bicarbonate extractable soil test P (STP, Olson, 1954), and ammonium acetate extractable soil test K (STK) (USEPA, 1996).
Based on STP and STK levels, P and K nutrient input recommendations were determined for sugarbeet, corn, spring malt barley, and potato (Russet Burbank) according to research-based recommendations (Amalgamated Sugar Company, 2020; Walsh et al., 2019; Brown et al., 2020; Robertson et al., 2003; Stark et al., 2004). Sugarbeet and potato (Russet Burbank) K recommendations are linked to yield goals. A sugarbeet yield goal of 90 Mg ha-1 (40 tons ac-1) and a potato (Russet Burbank) yield goal of 112 kg ha-1 (100 cwt ac-1) were used. The remaining P and K recommendations for all crops are not linked to a yield goal. The P and K fertilizer prices over time were obtained by DTN, a data acquisition and analysis company (DTN, 2022, Figure 1).
2.2 PCC Analysis
Samples were collected from two PCC stockpiles at the Paul, ID sugarbeet processing factory, the largest sugarbeet factory in the Northwest U.S. The PCC was sampled at four locations on top of each stockpile at 0.3 m (1 ft) depth increments to 1.5 m (5 ft) (Table 2). The PCC was analyzed for total P, K, and Zn with ICP-OES detection (USEPA, 1996).
Selected STP data from Tarkalson et al. (2022) and continuing research at our research locatioin was used to show the effect of PCC on STP. This work was comprised of three separate studies established in consecutive years near Kimberly ID. The studies received PCC applications in the fall to silt loam soil plots (6.7 m × 18.3 m [22 ft × 60 ft]) at rates of 7, 22, 90 Mg ha-1 (3, 10, and 40 tons ac-1). The PCC treatments were replicated 4 times in a randomized block design. Soil from each plot was sampled in the fall prior to PCC application and in the following spring prior to sugarbeet planting. Soil samples were analyzed for sodium bicarbonate extractable STP (Olsen, 1954).
The ASCO AgriData, P and K fertilizer price data, and PCC P and K lab analysis results were used to determine PCC Fertilizer P value, PCC needed to meet crop P requirements, P Fertilizer Savings from PCC, and total PCC Fertilizer P value for sugarbeet, corn, spring malt barley, and potato (Russet Burbank) (ASCO, 2020; Walsh et al., 2019; Brown et al., 2020; Robertson et al., 2003; Stark et al., 2004).
2.3 PCC Economic Analysis
This paper assessed the P and K quantity in PCC and determined the economic value of PCC based on the value of equivalent P and K in fertilizer. The ASCO payment for PCC removal from factory stockpiles, transportation and application costs of PCC and P fertilizers was not accounted for in the economic analyses. The P fertilizer replacement value of PCC was based on annual average fertilizer P prices (monoammonium phosphate and diammonium phosphate) in 2018, 2019, 2020, 2021, and 2022 (Figure 1). Other value-based uses such as Aphanomyces cochlioides suppression (Breshnahan et al. 2003) will not be assessed in this paper. In our analysis, the P and K fertilizer replacement value of PCC was based on the following scenarios:
- Fields requiring only P, and fields requiring P and K: PCC was assumed to be applied at a rate to meet the crop P requirement and the P in PCC was given fertilizer replacement value. When the PCC application rate was insufficient to meet the crop K recommendation, all the applied K was given fertilizer replacement value. When the PCC application rate applied excess K relative to the K requirement, only the K applied to meet the crop K requirement was given fertilizer replacement value.
- Fields requiring only K: PCC was applied at a rate to meet the crop K requirement and the K in PCC was given fertilizer replacement value. No P from the PCC application was given fertilizer replacement value.
| Table 1. Reported plant nutrient concentrations in precipitated calcium carbonate (PCC) across locations and time. | |||||
| Study | Location | Year | P2O5 | K2O | Zn |
| kg Mg-1
(lbs ton-1) |
kg Mg-1
(lbs ton-1) |
kg Mg-1
(lbs ton-1) |
|||
| Sailsbery and Hills, 1987† | California | 1976 | 27 (24) | — | — |
| Sims et al., 2010 | Minnesota‡ | 2005 | 27 (24) | 2.8 (2.5) | — |
| Sims et al., 2010 | North Dakota§ | 2005 | 25 (22) | 4.3 (3.8) | — |
| Hergert et al., 2017 | Nebraska | 2012 | 24 (21) | 3.0 (2.7) | 0.10 (0.09) |
| Hergert et al., 2017 | Wyoming | 2012 | 27 (24) | 5.0 (4.5) | 0.10 (0.09) |
| Hergert et al., 2017 | Colorado | 2012 | 24 (21) | 5.2 (4.6) | 0.10 (0.09) |
| Tarkalson et al., 2022 | Idaho | 2016 | 34 (30) | 2.7 (2.4) | 0.08 (0.07) |
| † No data available.
‡Average over PCC from 4 sugarbeet processing factories. §Average over PCC from 3 sugarbeet processing factories.
|
|||||
| Table 2. Concentrations of plant available nutrients in precipitated calcium carbonate (PCC) produced at the Paul, ID sugarbeet processing plant. | |||||||||
| Pile Location | Depth | Total P | Total K | Inorg. N† | Total Zn | Total P2O5 | Total K2O | Inorg. N | Total Zn |
| m (ft) | ———————–mg kg-1———————– | ————————- kg Mg-1 (lbs ton-1) ————————- | |||||||
| 1 | 0-0.3 (0-1) | 5409 | 3109 | 86.4 | 32.5 | 12.4 (24.8) | 3.8 (7.5) | 0.087 (0.173) | 0.033 (0.065) |
| 0.3-0.6 (1-2) | 4612 | 2535 | 59.9 | 22.8 | 10.6 (21.1) | 3.1 (6.1) | 0.060 (0.120) | 0.023 (0.046) | |
| 0.6-0.9 (2-3) | 5080 | 2289 | 28.5 | 23.5 | 11.7 (23.3) | 2.8 (5.5) | 0.029 (0.057) | 0.024 (0.047) | |
| 0.9-1.2 (3-4) | 5701 | 1557 | 39.0 | 22.9 | 13.1 (26.1) | 1.9 (3.7) | 0.039 (0.078) | 0.023 (0.046) | |
| 1.2-1.6 (4-6) | 5086 | 1540 | 93.3 | 23.4 | 11.7 (23.3) | 1.9 (3.7) | 0.094 (0.187) | 0.024 (0.047) | |
| Mean | 5178 | 2206 | 61.4 | 25.0 | 11.9 (23.7) | 2.7 (5.3) | 0.062 (0.123) | 0.025 (0.050) | |
| 2 | 0-0.3 (0-1) | 7215 | 3012 | 196.6 | 24.0 | 16.5 (33.0) | 3.6 (7.2) | 0.197 (0.393) | 0.024 (0.048) |
| 0.3-0.6 (1-2) | 5517 | 1479 | 41.5 | 22.6 | 12.7 (25.3) | 1.8 (3.5) | 0.042 (0.083) | 0.023 (0.045) | |
| 0.6-0.9 (2-3) | 4052 | 1549 | 18.7 | 20.4 | 9.3 (18.6) | 1.9 (3.7) | 0.019 (0.037) | 0.021 (0.041) | |
| 0.9-1.2 (3-4) | 5190 | 1394 | 34.2 | 21.0 | 11.9 (23.8) | 1.7 (3.3) | 0.034 (0.068) | 0.021 (0.042) | |
| 1.2-1.6 (4-6) | 5750 | 1407 | 34.9 | 19.7 | 13.2 (26.3) | 1.7 (3.4) | 0.035 (0.070) | 0.020 (0.039) | |
| Mean | 5545 | 1768 | 65.2 | 21.5 | 12.7 (25.4) | 2.1 (4.2) | 0.065 (0.130) | 0.022 (0.043) | |
| 3 | 0-0.3 (0-1) | 5319 | 1562 | 34.4 | 34.0 | 12.2 (24.4) | 1.9 (3.7) | 0.035 (0.069) | 0.034 (0.068) |
| 0.3-0.6 (1-2) | 5207 | 1405 | 11.6 | 35.3 | 11.9 (23.8) | 1.7 (3.4) | 0.012 (0.023) | 0.036 (0.071) | |
| 0.6-0.9 (2-3) | 5494 | 1228 | 12.6 | 34.6 | 12.6 (25.2) | 1.5 (2.9) | 0.013 (0.025) | 0.035 (0.069) | |
| Mean | 5340 | 1398 | 19.5 | 34.6 | 12.3 (24.5) | 1.7 (3.3) | 0.020 (0.039) | 0.029 (0.058) | |
| 4 | 0-0.3 (0-1) | 5241 | 1130 | 16.9 | 32.2 | 12.0 (24.0) | 1.4 (2.7) | 0.017 (0.034) | 0.032 (0.064) |
| 0.3-0.6 (1-2) | 5262 | 1170 | 7.6 | 33.9 | 12.1 (24.1) | 1.4 (2.8) | 0.008 (0.015) | 0.034 (0.068) | |
| 0.6-0.9 (2-3) | 5869 | 1181 | 7.5 | 33.3 | 13.5 (26.9) | 1.4 (2.8) | 0.008 (0.015) | 0.034 (0.067) | |
| 0.9-1.2 (3-4) | 5970 | 1339 | 9.9 | 37.6 | 13.7 (27.3) | 1.6 (3.2) | 0.010 (0.020) | 0.038 (0.075) | |
| Mean | 5586 | 1205 | 10.5 | 34.3 | 12.8 (25.6) | 1.5 (2.9) | 0.011 (0.021) | 0.033 (0.066) | |
| All Site/Depth | Mean | 5410 | 1699 | 43.1 | 27.9 | 12.4 (24.8) | 2.1 (4.1) | 0.043 (0.086) | 0.028 (0.056) |
| † Inorganic N = NO3-N + NH4-N | |||||||||
Scenario Calculations
Values in Tables 3, 4, 5, and 6 are averaged across years for each crop from field level data. The scenario calculations were also conducted at the field level, thus, when calculations are done using table averages will result in variation in the results for: P and K Fertilizer Savings from PCC and Total Area P and K Fertilizer Savings from PCC (Eqs. 1d and 1e, Scenario 1), and K Fertilizer Savings from PCC and Total Area K Fertilizer Savings from PCC (Eqs. 2d and 2e, Scenario 2).
Scenario 1 (Table 3 and Table 4):
Eq. 1a: P Fertilizer Value of PCC = P Fertilizer Price × P Concentration in PCC
Where, P Fertilizer value of PCC = $ Mg-1 PCC ($ ton-1 PCC), Fertilizer P Price = $ kg-1 P2O5 ($ lb-1 P2O5), P Concentration in PCC= 12.4 kg P2O5 Mg-1 (24.8 lbs P2O5 ton-1).
Eq. 1b: PCC Rate Needed to Meet Crop P Fertilizer Requirement = P Recommendation / P Concentration in PCC
Where, PCC Needed to Meet P Requirement = Mg PCC ha-1 (tons PCC ac-1), P Recommendation = $ kg-1 P2O5 ($ lbs-1 P2O5), P Concentration in PCC = 12.4 kg P2O5 Mg-1 (24.8 lbs P2O5 ton-1) (Table 2).
Eq. 1c: K Fertilizer Value of PCC = K Fertilizer Price × K Concentration in PCC
Where, K Fertilizer value of PCC = $ Mg-1 PCC ($ ton-1 PCC), Fertilizer K Price = $ kg-1 K2O ($ lb-1 K2O), K Concentration in PCC = 2.1 kg P2O5 Mg-1 (4.1 lbs K2O ton-1).
Eq. 1d: P and K Fertilizer Savings from PCC = A + B
- For fields where the rate of PCC needed to meet K requirements is higher than the rate of PCC to meet the P requirement = (PCC Needed to Meet Crop P Requirement × P Fertilizer Value of PCC) + (PCC Needed to Meet Crop P Requirement × K Fertilizer Value of PCC).
- For fields where the rate where the PCC application rate applied sufficient K to meet the crop K requirement = (PCC Needed to Meet Crop P Requirement × P Fertilizer Value of PCC) + (PCC Needed to Meet Crop K Requirement from PCC Needed to Meet Crop P Requirement × K Fertilizer Value of PCC).
Where, P and K Fertilizer Savings from PCC = $ ha-1 ($ ac-1), PCC Needed to Meet Crop P Fertilizer Requirement = Mg ha-1 (tons ac-1), PCC Needed to Meet Crop K Fertilizer Requirement = Mg ha-1 (tons ac-1), P Fertilizer Value of PCC = $ Mg-1 PCC ($ ton-1 PCC), K Fertilizer Value of PCC = $ Mg-1 PCC ($ ton-1 PCC).
Eq. 1e: Total Area P and K Fertilizer Savings from PCC = P and K Fertilizer Savings from PCC × Area Requiring P and K
Where, Total Area P and K Fertilizer Savings from PCC = $, P and K Fertilizer Savings from PCC = $ ha-1 ($ ac-1), Area Requiring P = ha (ac). Values rounded to the nearest 1,000 ac.
| Table 3. Scenario 1 (Fields with a crop P requirement, and with or without a K requirement) agronomic data. Land area and soil test data are from the ASCO AgriData database. For each year, values are derived from the assumption the entire area will grow the listed crop. Crop P recommendations are based on published sources (Amalgamated Sugar Company, 2020; Walsh et al., 2019; Brown et al., 2020; Robertson et al., 2003; Stark et al., 2004). | ||||||||||
| Year | Total Area | Area Requiring P | Area Requiring P and K | Percent of Total Area Requiring P and K | Percent of Total Area Requiring K | Average STP† of Area Requiring P | Average P2O5 Recommendation of Area Requiring P | Average STK‡ of Area Requiring K | Average K2O Recommendation of Area Requiring K | K2O Applied in PPC§ Credited to K Recommendation |
| —————————-ha (ac)—————————- | % | mg kg-1 | kg ha-1 (lbs ac-1) | mg kg-1 | ———– kg ha-1 (lbs ac-1) ———– | |||||
| Sugarbeet | ||||||||||
| 2018 | 63052 (155804) | 17762 (43891) | 8791 (21723) | 28.2 | 13.9 | 15.5 | 100 (89) | 126.7 | 146 (130) | 36 (32) |
| 2019 | 64975 (160557) | 20465 (50571) | 10525 (26009) | 31.5 | 16.2 | 16.1 | 94 (84) | 138.7 | 113 (101) | 28 (25) |
| 2020 | 66859 (165211) | 23986 (59271) | 15003 (37073) | 35.9 | 22.4 | 15.7 | 100 (89) | 137.9 | 115 (103) | 28 (25) |
| 2021 | 67471 (166724) | 24378 (60240) | 15124 (37373) | 36.1 | 22.4 | 13.7 | 122 (109) | 124.9 | 150 (134) | 37 (33) |
| Mean | 65589 (162074) | 21648 (53493) | 12361 (30545) | 33.0 | 18.8 | 15.3 | 104 (93) | 132.1 | 131 (117) | 32 (29) |
| Corn | ||||||||||
| 2018 | 63052 (155804) | 5970 (14753) | 3450 (8525) | 9.5 | 5.5 | 11.5 | 31 (28) | 113.6 | 100 (89) | 25 (22) |
| 2019 | 64975 (160557) | 5459 (13490) | 2634 (6508) | 8.4 | 4.1 | 11.7 | 30 (27) | 129.1 | 76 (68) | 19 (17) |
| 2020 | 66859 (165211) | 7782 (19230) | 5282 (13052) | 11.6 | 7.9 | 11.8 | 28 (25) | 131.4 | 73 (65) | 18 (16) |
| 2021 | 67471 (166724) | 9589 (23696) | 6072 (15005) | 14.2 | 9.0 | 9.1 | 53 (47) | 106.4 | 110 (98) | 27 (24) |
| Mean | 65589 (162074) | 7200 (17792) | 4306 (10773) | 11.0 | 6.6 | 11.0 | 36 (32) | 120.1 | 90 (80) | 22 (20) |
| Spring Malt Barley | ||||||||||
| 2018 | 63052 (155804) | 11469 (28340) | 877 (2166) | 18.2 | 1.4 | 13.6 | 78 (70) | 14.1 | 218 (195) | 29 (26) |
| 2019 | 64975 (160557) | 12569 (31059) | 142 (350) | 19.3 | 0.2 | 14.2 | 74 (66) | 47.8 | 97 (87) | 17 (15) |
| 2020 | 66859 (165211) | 15696 (38786) | 303 (749) | 23.5 | 0.5 | 13.9 | 75 (67) | 40.0 | 125 (112) | 28 (25) |
| 2021 | 67471 (166724) | 17197 (42494) | 2114 (5224) | 25.5 | 3.1 | 11.7 | 102 (91) | 14.0 | 218 (195) | 24 (21) |
| Mean | 65589 (162074) | 14233 (35170) | 859 (2122) | 21.7 | 1.3 | 13.4 | 83 (74) | 29.0 | 165 (147) | 25 (22) |
| Potato (Russet Burbank) | ||||||||||
| 2018 | 63052 (155804) | 23605 (58328) | 10224 (25265) | 18.2 | 16.2 | 16.9 | 116 (104) | 124.6 | 225 (201) | 55 (49) |
| 2019 | 64975 (160557) | 26009 (64270) | 11691 (28889) | 19.3 | 18.0 | 17.3 | 112 (100) | 136.8 | 171 (153) | 41 (37) |
| 2020 | 66859 (165211) | 30978 (76547) | 17586 (43455) | 23.5 | 26.3 | 16.8 | 120 (107) | 134.9 | 179 (160) | 44 (39) |
| 2021 | 67471 (166724) | 29288 (72373) | 17102 (42260) | 25.5 | 25.3 | 14.7 | 148 (132) | 122.5 | 235 (210) | 57 (51) |
| Mean | 65589 (162074) | 27470 (67879) | 14151 (34967) | 21.7 | 21.6 | 16.4 | 124 (111) | 129.7 | 203 (181) | 49 (44) |
| † STP = Soil test P
‡ STK = Soil test K § PCC = Precipitated calcium carbonate |
||||||||||
| Table 4. Scenario 1 (Fields with a crop P requirement, and with or without a K requirement) economic data. Determination of precipitated calcium carbonate (PCC) fertilizer value based on P and K content for the sugarbeet growing area in 2018, 2019, 2020, and 2021 for the Northwest U.S. For each year, analysis assumes all area will grow sugarbeet, corn, spring malt barley, or potato (Russet Burbank). Fertilizer P and K and (MAP, DAP, and Potash) values are the means across each year (DTN, 2022). The P fertilizer value in PCC is based on average annual MAP and DAP prices and average P2O5 content of lime (12.4 kg P2O5 Mg-1 PCC [24.8 lbs P2O5 ton-1 PCC], Table 2). The K fertilizer value in PCC is based on average annual Potash prices and average K2O content of lime (2.1 kg K2O Mg-1 PCC [4.1 lbs K2O ton-1 PCC], Table 2). Data for 2022 is based on mean values across all years (2018-2021) in Table 3. | |||||||
| Year† | Fertilizer P Price‡ | P Fertilizer Value of PCC | PCC Rate Needed to Meet Crop P Fertilizer Requirement | Fertilizer K Price
|
K Fertilizer Value of PCC | P and K Fertilizer Savings from PCC | Total Area P and K Fertilizer Savings from PCC |
| Eq. 1a | Eq. 1b | Eq. 1c | Eq. 1d | Eq. 1e | |||
| $ kg-1 P2O5
($ lb-1 P2O5) |
$ Mg-1 PCC
($ ton-1 PCC) |
Mg ha-1
(ton ac-1) |
$ kg-1 K2O
($ lb-1 K2O) |
$ Mg-1 PCC
($ ton-1 PCC) |
$ ha-1
($ ac-1) |
$ | |
| Sugarbeet | |||||||
| 2018 | 0.23 (0.51) | 13.94 (12.65) | 8.09 (3.61) | 0.13 (0.29) | 1.31 (1.19) | 118.51 (47.96) | 2,106,000 |
| 2019 | 0.23 (0.51) | 13.94 (12.65) | 7.60 (3.39) | 0.14 (0.31) | 1.40 (1.27) | 111.37 (45.07) | 2,201,000 |
| 2020 | 0.20 (0.45) | 12.30 (11.16) | 8.03 (3.58) | 0.13 (0.29) | 1.31 (1.19) | 104.72 (42.38) | 2,603,000 |
| 2021 | 0.34 (0.74) | 20.23 (18.35) | 9.89 (4.41) | 0.20 (0.44) | 1.98 (1.80) | 210.21 (85.07) | 4,689,000 |
| 2022 | 0.47 (1.03) | 28.15 (25.54) | 8.41 (3.75) | 0.32 (0.70) | 3.16 (2.87) | 236.68 (95.78) | 5,123,000 |
| Corn | |||||||
| 2018 | 0.23 (0.51) | 13.94 (12.65) | 2.53 (1.13) | 0.13 (0.29) | 1.31 (1.19) | 37.49 (15.17) | 223,000 |
| 2019 | 0.23 (0.51) | 13.94 (12.65) | 2.42 (1.08) | 0.14 (0.31) | 1.40 (1.27) | 35.58 (14.40) | 199,000 |
| 2020 | 0.20 (0.45) | 12.30 (11.16) | 2.29 (1.02) | 0.13 (0.29) | 1.31 (1.19) | 30.12 (12.19) | 256,000 |
| 2021 | 0.34 (0.74) | 20.23 (18.35) | 4.28 (1.91) | 0.20 (0.44) | 1.98 (1.80) | 90.32 (36.55) | 765,000 |
| 2022 | 0.47 (1.03) | 28.15 (25.54) | 2.89 (1.29) | 0.32 (0.70) | 3.16 (2.87) | 81.42 (32.95) | 586,000 |
| Spring Malt Barley | |||||||
| 2018 | 0.23 (0.51) | 13.94 (12.65) | 6.34 (2.83) | 0.13 (0.29) | 1.31 (1.19) | 89.90 (36.38) | 1,035,000 |
| 2019 | 0.23 (0.51) | 13.94 (12.65) | 5.94 (2.65) | 0.14 (0.31) | 1.40 (1.27) | 82.93 (33.56) | 990,000 |
| 2020 | 0.20 (0.45) | 12.30 (11.16) | 6.08 (2.71) | 0.13 (0.29) | 1.31 (1.19) | 74.92 (30.32) | 1,243,000 |
| 2021 | 0.34 (0.74) | 20.23 (18.35) | 8.20 (3.66) | 0.20 (0.44) | 1.98 (1.80) | 168.53 (68.20) | 2,511,000 |
| 2022 | 0.47 (1.03) | 28.15 (25.54) | 6.68 (2.98) | 0.32 (0.70) | 3.16 (2.87) | 188.32 (76.21) | 2,680,000 |
| Potato (Russet Burbank) | |||||||
| 2018 | 0.23 (0.51) | 13.94 (12.65) | 9.44 (4.21) | 0.13 (0.29) | 1.31 (1.19) | 137.69 (55.72) | 3,197,000 |
| 2019 | 0.23 (0.51) | 13.94 (12.65) | 9.06 (4.04) | 0.14 (0.31) | 1.40 (1.27) | 132.18 (53.49) | 3,422,000 |
| 2020 | 0.20 (0.45) | 12.30 (11.16) | 9.68 (4.32) | 0.13 (0.29) | 1.31 (1.19) | 125.80 (50.91) | 3,898,000 |
| 2021 | 0.34 (0.74) | 20.23 (18.35) | 11.90 (5.31) | 0.20 (0.44) | 1.98 (1.80) | 252.57 (102.21) | 6,743,000 |
| 2022 | 0.47 (1.03) | 28.15 (25.54) | 10.04 (4.48) | 0.32 (0.70) | 3.16 (2.87) | 282.47 (114.31) | 7,759,000 |
| † 2022 calculations are based on annual mean values in Table 3. Fertilizer price used are the mean for 2022 (Figure 1).
‡ Yearly mean fertilizer P and K (MAP, DAP and Potash) prices for 2018, 2019, 2020, and 2021 (Figure 1). |
|||||||
Scenario 2 (Table 5 and Table 6):
Eq. 2a: K Fertilizer Value of PCC = K Fertilizer Price × K Concentration in PCC
Where, K Fertilizer value of PCC = $ ha-1 PCC ($ ton-1 PCC), Fertilizer K Price = $ kg-1 K2O ($ lb-1 K2O), K Concentration in PCC = 2.1 kg P2O5 Mg-1 (4.1 lbs K2O ton-1).
Eq. 2b: PCC Rate Needed to Meet Crop K Fertilizer Requirement = K Recommendation / K Concentration in PCC
Where, PCC Needed to Meet K Requirement = tons PCC ac-1, K Recommendation = kg K2O ha-1 (lbs K2O ac-1), K Concentration in PCC = 2.1 kg P2O5 Mg-1 (4.1 lbs K2O ton-1) (Table 2).
Eq. 2c: K Fertilizer Savings from PCC = PCC Needed to Meet Crop K Requirement × K Fertilizer Value of PCC
Where, K Fertilizer Savings from PCC = $ ha-1 ($ ac-1), PCC Needed to Meet Crop K Fertilizer Requirement = tons/ac, PCC K Fertilizer Value = $ Mg-1 PCC ($ ton-1 PCC).
Eq. 2d: Total Area K Fertilizer Savings from PCC = K Fertilizer Savings from PCC × Area Requiring K
Where, Total Area K Fertilizer Savings from PCC = $, K Fertilizer Savings from PCC = $ ha-1 ($ ac-1), Area Requiring K = ha (ac). Values rounded to the nearest 1,000 ac.
| Table 5. Scenario 2 (Fields with a crop K requirement but no crop P requirement) agronomic data. Land area and soil test data are from the ASCO AgriData database. For each year, values are derived from the assumption the entire area will grow the listed crop. Crop K recommendations are based on published sources (Amalgamated Sugar Company, 2020; Walsh et al., 2019; Brown et al., 2020; Robertson et al., 2003; Stark et al., 2004). | ||||||
| Year | Total Area | Area Requiring K | Percent of Total Area Requiring K | Average STK† | K2O Recommendation | |
| ————–ha (ac)————- | % | mg kg-1 | kg ha-1 (lbs ac-1) | |||
| Sugarbeet | ||||||
| 2018 | 63052 (155804) | 10274 (25388) | 16.3 | 141 | 105 (94) | |
| 2019 | 64975 (160557) | 9749 (24091) | 15.0 | 149 | 84 (75) | |
| 2020 | 66859 (165211) | 11961 (29555) | 17.9 | 143 | 102 (91) | |
| 2021 | 67471 (166724) | 14565 (35990) | 21.6 | 142 | 104 (93) | |
| Mean | 65589 (162074) | 11637 (28756) | 17.7 | 144 | 99 (88) | |
| Corn | ||||||
| 2018 | 63052 (155804) | 15615 (38586) | 24.8 | 140 | 60 (54) | |
| 2019 | 64975 (160557) | 17641 (43592) | 27.2 | 147 | 49 (44) | |
| 2020 | 66859 (165211) | 21617 (53575) | 32.4 | 143 | 56 (50) | |
| 2021 | 67471 (166724) | 23617 (58358) | 35.0 | 142 | 57 (51) | |
| Mean | 65589 (162074) | 19639 (48528) | 29.9 | 143 | 56 (50) | |
| Spring Malt Barley | ||||||
| 2018 | 63052 (155804) | 612 (1512) | 1.0 | 23 | 185 (165) | |
| 2019 | 64975 (160557) | 127 (315) | 0.2 | 34 | 149 (133) | |
| 2020 | 66859 (165211) | 458 (1131) | 0.7 | 23 | 186 (166) | |
| 2021 | 67471 (166724) | 416 (1029) | 0.6 | 18 | 205 (183) | |
| Mean | 65589 (162074) | 403 (997) | 0.6 | 24 | 181 (162) | |
| Potato (Russet Burbank) | ||||||
| 2018 | 63052 (155804) | 6599 (16307) | 10.5 | 137 | 172 (154) | |
| 2019 | 64975 (160557) | 6403 (15821) | 9.9 | 146 | 131 (117) | |
| 2020 | 66859 (165211) | 7191 (17769) | 10.8 | 141 | 152 (136) | |
| 2021 | 67471 (166724) | 9761 (24121) | 14.5 | 139 | 164 (146) | |
| Mean | 65589 (162074) | 7488 (18504) | 11.4 | 140 | 155 (138) | |
| † STK = Soil test K
|
||||||
| Table 6. Scenario 2 (Fields with a crop K requirement but no crop P requirement) economic data. Determination of precipitated calcium carbonate (PCC) fertilizer value based on K content for the sugarbeet growing area in 2018, 2019, 2020, and 2021 for the Northwest U.S. For each year, analysis assumes all area will grow sugarbeet, corn, spring malt barley, or potato (Russet Burbank). Fertilizer K (Potash) values are the means across each year (DTN, 2022). The K fertilizer value in PCC is based on average annual Potash prices and average K2O content of lime (2.1 kg K2O Mg-1 PCC [4.1 lbs K2O ton-1 PCC], Table 2). Data for 2022 is based on mean values across all years (2018-2021) in Table 4. | |||||
| Year† | Fertilizer K Price‡ | K Fertilizer Value of PCC | PCC Rate Needed to Meet K Fertilizer Requirement | K Fertilizer Savings from PCC | Total Area PCC K Fertilizer Value K Fertilizer Savings from PCC |
| Eq. 2a | Eq. 2b | Eq. 2c | Eq. 2d | ||
| $ kg-1 K2O
($ lb-1 K2O) |
$ Mg-1 PCC
($ ton-1 PCC) |
Mg ha-1
(ton ac-1) |
$ ha-1
($ ac-1) |
$ | |
| Sugarbeet | |||||
| 2018 | 0.13 (0.29) | 1.31 (1.19) | 51.6 (23.0) | 67.63 (27.37) | 674,000 |
| 2019 | 0.14 (0.31) | 1.40 (1.27) | 41.0 (18.3) | 57.62 (23.32) | 532,000 |
| 2020 | 0.13 (0.29) | 1.31 (1.19) | 49.8 (22.2) | 65.33 (26.44) | 743,000 |
| 2021 | 0.20 (0.44) | 1.98 (1.80) | 50.9 (22.7) | 101.31 (41.00) | 1,341,000 |
| 2022 | 0.32 (0.70) | 3.16 (2.87) | 48.4 (21.6) | 152.83 (61.85) | 1,779,000 |
| Corn | |||||
| 2018 | 0.13 (0.29) | 1.31 (1.19) | 29.4 (13.1) | 38.60 (15.62) | 601,000 |
| 2019 | 0.14 (0.31) | 1.40 (1.27) | 24.2 (10.8) | 33.98 (13.75) | 582,000 |
| 2020 | 0.13 (0.29) | 1.31 (1.19) | 27.1 (12.1) | 35.66 (14.43) | 761,000 |
| 2021 | 0.20 (0.44) | 1.98 (1.80) | 28.0 (12.5) | 55.52 (22.47) | 1,288,000 |
| 2022 | 0.32 (0.70) | 3.16 (2.87) | 27.1 (12.1) | 85.99 (34.80) | 1,689,000 |
| Spring Malt Barley | |||||
| 2018 | 0.13 (0.29) | 1.31 (1.19) | 90.3 (40.3) | 118.54 (47.97) | 69,000 |
| 2019 | 0.14 (0.31) | 1.40 (1.27) | 72.6 (32.4) | 101.73 (41.17) | 17,000 |
| 2020 | 0.13 (0.29) | 1.31 (1.19) | 90.6 (40.4) | 118.61 (48.00) | 58,000 |
| 2021 | 0.20 (0.44) | 1.98 (1.80) | 100.0 (44.6) | 198.77 (80.44) | 90,000 |
| 2022‡ | 0.32 (0.70) | 3.16 (2.87) | 88.3 (39.4) | 279.60 (113.15) | 113,000 |
| Potato (Russet Burbank) | |||||
| 2018 | 0.13 (0.29) | 1.31 (1.19) | 84.1 (37.5) | 110.28 (44.63) | 716,000 |
| 2019 | 0.14 (0.31) | 1.40 (1.27) | 64.1 (28.6) | 89.75 (36.32) | 561,000 |
| 2020 | 0.13 (0.29) | 1.31 (1.19) | 74.6 (33.3) | 97.75 (39.56) | 677,000 |
| 2021 | 0.20 (0.44) | 1.98 (1.80) | 79.6 (35.5) | 158.34 (64.08) | 1,401,000 |
| 2022 | 0.32 (0.70) | 3.16 (2.87) | 75.5 (33.7) | 239.17 (96.79) | 1,791,000 |
| † 2022 calculations are based on annual mean values in Table 3. Fertilizer price used are the mean for 2022 (Figure 1).
‡ Yearly mean fertilizer P and K [diammonium phosphate (DAP), monoammonium phosphate (MAP), and Potash] prices for 2018, 2019, 2020, and 2021 (Figure 1). |
|||||
3 RESULTS AND DISCUSSION
3.1 ASCO AgriData
Of the total acres in the ASCO AgriData, 91% were used in this analysis. The 9% of data removed represented outliers caused by possible soil test analysis errors or data entry errors. However, the deleted data was not confirmed as erroneous, it was removed simply to increase confidence in the remaining data. Outliers were removed when they met the following criteria: soil free lime > 15% (1,732 ha [4,280 ac]), soil pH < 5 (18,261 ha [45,125 ac]), soil pH > 8.5 (2,887ha [7,134 ac]), STP = 0 mg kg-1 (1,594 ha [3,940 ac]), soil test K (SPK) = 0 mg kg-1 (252 ha [622 ac]) and fields < 10 acres (44,644 ha [110,318 ac]). After filtering, the cropland area used in the analysis in 2018, 2019, 2020, and 2021 was 63,052 ha (155,804 ac), 64,975 ha (160,557 ac), 66,859 ha (165,211 ac) and 67,471 ha (166,724 ac), respectively. The filtered cropland area is 91% of the total area across years. The average number of fields per year was 2,085. Averaged across years, the area of fields requiring P and K (scenario 1) for proposed crops of sugarbeet, corn, spring malt barley, and potato (Russet Burbank) totaled 21,648 ha (53,493 ac), 7,200 ha (17,792 ac), 14,233 ha (35,170 ac), 27,470 ha (67,879 ac), respectively (Table 3). Averaged across years, area requiring only P (scenario 1) for proposed crops of sugarbeet, corn, spring malt barley, and potato (Russet Burbank) totaled 9,287 ha (22,949 ac), 2,841 ha (7,020 ac), 13,374 ha (33,047 ac), 13,319 ha (32,912 ac), respectively (Table 3). Averaged across years, area with a K but not a P requirement (scenario 2) for proposed crop of sugarbeet, corn, spring malt barley, and potato (Russet Burbank) totaled 11,637 ha (28,756 ac), 19,639 ha (48,528 ac), 403 ha (997 ac), 7,488 ha (18,504 ac), respectively (Table 5). Averaged across years, area growing sugarbeet, corn, spring malt barley, and potato (Russet Burbank) with no P or K requirement totaled 32,304 ha (79,825 ac), 38,750 ha (95,754 ac), 50,953 ha (125,908 ac), 30,631 ha (75,691 ac), respectively (Table 3).
Across all crops and years, an average of 27% of total cropped area required P or K fertilizer, indicating that there is significant potential market for a PCC as a P and K source. These acres had an average STP and STK levels of 13.5 mg P/kg and 122.7 mg K/kg (Table 3). Depending on free lime content of the soil, the threshold for STP adequacy was 15 to 25 mg/kg for crops assessed in this paper (ASCO, 2020; Walsh et al., 2019; Brown et al., 2020; Robertson et al., 2003; Stark et al., 2004). The threshold for STK adequacy was 75 to 187 mg/kg for crops assessed in this paper (ASCO, 2020; Walsh et al., 2019; Brown et al., 2020; Robertson et al., 2003; Stark et al., 2004). The P and K recommendations for these acres are dependent on crop, however, an annual average of 95 kg P2O5 ha-1 (85 lbs P2O5 acre-1) and 119 kg K2O ha-1 (106 lbs K2O acre-1) was required (Table 3). The average annual total P requirement crop ranking was potato (Russet Burbank) > sugarbeet > spring malt barley > corn. The average annual total K requirement crop ranking was potato (Russet Burbank) > sugarbeet > corn > spring malt barley.
3.2 PCC Nutrient Content
Total P and K concentrations in PCC sampled from the Paul, ID sugarbeet processing factory ranged from 9.3 to 16.5 kg P2O5 Mg-1 (18.6 to 33 lbs P2O5 ton-1) and 1.35 to 3.75 kg K2O Mg-1 (2.7 to 7.5 lbs K2O ton-1) across sample locations and depths (Table 2). The mean P and K concentrations were 12.4 kg P2O5 Mg-1 (24.8 lbs P2O5 ton-1) and 2.1 kg K2O Mg-1 (4.1 lbs K2O ton-1). These concentrations were within the ranges measured in PCC at other sugarbeet production areas of the US (Table 1). The P concentration in the PCC from the Paul, ID facility was slightly lower than PCC P from the Twin Falls, ID facility (15 kg P2O5 Mg-1 [30 lbs P2O5 ton-1]) (Tarkalson et al, 2022). However, the PCC from both locations contained significant concentrations of P, making both viable alternatives to fertilizer P.
In addition to P, PCC also contains small amounts of plant available nitrogen (N) (NH4-N + NO3-N) and Zn (0.045 kg N Mg-1 [0.09 lbs N ton-1] and 0.03 kg Zn Mg-1 [0.06 lbs Zn ton-1]) (Table 2). Although both these nutrients have fertilizer value, the application rate of PCC required to address any crop requirement for these nutrients would be so large as to make it impractical. The amount of plant available N was insignificant with respect to common crop N requirements. In this paper we only discuss PCC P and K data because the ASCO AgriData includes STP and STK data, not soil test Zn data. From 2018 to 2020, the average annual land area that had Zn applied was 1,288 ha (3,183 ac), with an average rate 20 kg Zn ha-1 (18 lbs Zn ac-1). A PCC application rate of 673 Mg ha-1 (300 tons ac-1) would be required to meet a rate of 20 kg Zn ha-1 (18 lbs Zn ac-1). Using PCC to meet Zn requirements would be impractical due to the high PCC application rates. Research has only evaluated the effect of PCC on crops and soils at rates up to 90 Mg ha-1 (40 tons ac-1) (Tarkalson et al., 2022). It is possible that at PCC application rates to meet P and K fertilizer requirements, useful crop nutrition amounts of Zn could be applied. The average amount of Zn and plant available N in the PCC applied at the rates under scenario 1 (fields requiring only P, and fields requiring P and K) and scenario 2 (fields requiring only K) across all years and crops would be 0.22 and 1.23 kg Zn ha-1 (0.2 and 1.1 lbs Zn ac-1) and 0.34 and 1.9 kg NO3-N+NH4-N ha-1 (0.3 and 1.7 lbs NO3-N+NH4-N ac-1). For this reason, only PCC P and K are considered for the economic analysis in this paper.
Demand for K fertilizer is not as great as for P fertilizer because most western U.S. soils have adequate native K levels for crop production. Data from a commercial soil analysis lab of over 8,800 soil samples from Idaho, Nevada, Utah, and Wyoming showed an average STK (ammonium acetate method) of 355 mg/kg (commercial lab director, per. comm.). For sugarbeet, corn, spring malt barley, and potato (Russet Burbank) in Idaho, K inputs are not recommended when soil test concentrations exceed 187, 180, 75, and 175 mg/kg, respectively. Despite this, the ASCO AgriData data set showed that 17,724 ha (43,798 ac) (27% of the land area), averaged across all years and crops in this study, required K additions (Table 5).
3.3 PCC Value
To determine the economic value of PCC, we assumed that PCC P and K have equivalent plant P and K availability as that of commercial fertilizer. Past research has supported this assumption (Sailsbery and Hill, 1987; Sims, 2010). Sailsbery and Hill (1987) found that sugarbeet production responded equally to P fertilizer and PCC when P was applied at the same rate of 134 kg P2O5 ha-1 (120 lbs P2O5 ac-1). The PCC P concentration in their study was kg 28 P2O5 ha-1 (25 lbs P2O5 ton-1) (Table 1). The fertilizer P and PCC was applied in the spring before sugarbeet planting and incorporated with tillage, providing evidence that the PCC P is readily available after application and incorporation. Sims (2010) showed that increases in STP after PCC application was a result of a significant portion of the PCC P becoming available soon after application. Although release dynamics were not measured directly in both Sailsbery and Hill (1987) and Sims (2010), increased plant available P was observed following PCC additions in both studies. Increased STP from PCC application were also observed by Tarkalson et al. (2022) and in continuing research at our research location (Figure 2). Across the three studies and three PCC rates, they found that PCC increased STP concentrations by an average of 0.6 mg kg-1 per ton of applied PCC from the fall application to the pre-plant soil test in the spring (Figure 2).
From 2020 to 2022 the annual mean P and K fertilizer prices increased 230% and 240%, respectively (Figure 1). This had a significant impact on the cost of agricultural production. These high costs have made alternative lower cost P sources, such as PCC, more attractive to growers. Across all scenarios the value of PCC as a P fertilizer ranged from $13.94 Mg-1 ($12.65 ton-1) in 2018 to $28.15 Mg-1 ($25.54 ton-1) in 2022 because of its direct relationship with the increase of P fertilizer price from $0.23 kg-1 P2O5 ($0.51 lb-1 P2O5) to $0.47 kg-1 P2O5 ($1.03 lb-1 P2O5) over the same time (Table 3 and Table 5). Across all scenarios the value of PCC as a K fertilizer ranged from $1.31 Mg-1 ($1.19 ton-1) in 2018 to $3.16 Mg-1 ($2.87 ton-1) in 2022 because of its direct relationship with the increase of K fertilizer price from $0.13 kg-1 K2O ($0.29 lb-1 K2O) to $0.32 kg-1 K2O ($0.70 lb-1 K2O) over the same time (Table 3 and Table 5). As a result, P fertilizer savings arising from substituting PCC for P fertilizer also increased over time.
Before applying these results to real-world situations, we note that there may be additional site-specific costs and/or logistical issues that may need to be considered in to understand the true economic value of PCC more fully for a particular farm or field. It is also noteworthy that PCC has economic value in addition to its benefits as a nutrient source. For example, the economic value of reducing stockpile P accumulation could be a viable economic rationale for application of PCC to agricultural fields, particularly because ASCO is a grower owned cooperative and PCC utilization strategies are economically important for sugarbeet growers. Additionally, PCC has economic value when used for Aphanomyces disease suppression in sugarbeet production. In some areas this is the primary reason for PCC application.
This paper relates the price of P and K in fertilizer to PCC. Due to the lower concentration of P in PCC compared to P fertilizer, greater PCC amounts need to be applied, so transportation and application costs of PCC solely as a P source will be higher than P fertilizer. The final price of nutrients needs to account for these costs. These costs will vary based on distance from stockpiles to fields, and transportation and application equipment costs. Transportation and application costs are highly variable. For example, in the ASCO growing area during the harvest season (September and October), ASCO can use sugarbeet haul trucks to back haul the PCC to fields near sugarbeet collection piles that the trucks are traveling to collect sugarbeets. However, this method is only viable during the harvest season. An additional economic factor to consider is that ASCO currently offers a payment incentive to growers of $3.31 Mg-1 PCC ($3 ton-1 PCC) for PCC removed from stockpiles for agricultural use (minimum of 13.6 Mg [15 tons] PCC required for payment).
3.3.1 Scenario 1: Fields with both a crop P and a K requirement
Assuming PCC replaced P and K fertilizer as a nutrient source, the total quantity of PCC required to meet the P crop recommendations for all acres under scenario 1 was 183,191 Mg (201,933 tons), 21,799 Mg (24,029 tons), 95,968 Mg (105,787 tons), and 276,736 Mg (305,049 tons) for sugarbeet, corn, spring malt barley, and potato (Russet Burbank), respectively (averaged across years). Assuming the annual production of PCC from all ASCO factories remains at around 351,081 dry Mg yr-1 (387,000 dry tons yr-1), and PCC will be used as the sole P fertilizer source for all ASCO AgriData acres going into sugarbeet, 52% of the annually produced PCC would be utilized. This PCC utilization does not account for PCC applications that are possible for other acres with sugarbeet in rotation that are growing other crops (approximately 153,376 ha [379,000 ac] annually). Additionally, other crop land without sugarbeets in rotation could also utilize PCC as a P source.
If PCC is applied for other reasons beyond meeting P recommendations (Aphanomyces cochlioides related disease suppression in sugarbeet production, bulk land application to reduce stockpiles, etc.) more PCC from stockpiles would be needed, reducing the overall stockpiled quantity over time. Current stockpiles are estimated to contain over 5.1 million dry Mg (12.6 million dry tons).
Averaged across years for sugarbeet, corn, spring malt barley, and potato (Russet Burbank), the amount of K applied in PCC after meeting the P requirement was on average 75% 75% 84%, and 76% less than the K crop requirement (131, 90, 165, 203 kg K2O ha-1 [117, 80, 147, 181 lbs K2O ac-1]), respectively (Table 3).
Under this scenario, the P and K fertilizer savings from using PCC as an alternative P and K source, increased from $95.90 ha-1 ($38.81 ac-1) in 2018 to $197.21 ha-1 ($79.81 ac-1) in 2022, an increase of 206% (Table 4). From 2018 to 2022 summed across all acres, the total fertilizer P and K value of PCC when applied to meet P crop requirements ranged from $2,106,000 to $5,123,000 for sugarbeet, $199,000 to $765,00 for corn, $990,000 to $2,680,000 for spring malt barley, and $3,197,000 to $7,759,000 for potato (Russet Brubank) (Table 4).
3.3.2 Scenario 2: Fields with a crop K requirement but no crop P requirement
Assuming PCC replaced K fertilizer as a nutrient source, the total quantity of PCC required to meet the K recommendations for all acres under this scenario was 566,511 Mg (624,471 tons), 533,879 Mg (588,501 tons), 36,905 Mg (40,681 tons), and 569,711 Mg (627,999 tons) for sugarbeet, corn, spring malt barley, and potato (Russet Burbank), respectively (Table 2 and Table 5).
Assuming the annual production of PCC from all ASCO factories remains at around 351,081 dry Mg yr-1 (387,000 dry tons yr-1), and PCC will be used as the sole K fertilizer source for all ASCO AgriData acres going into sugarbeet, 161% of the annually produced PCC would be utilized. However, current PCC storage amounts are available. This PCC utilization does not account for PCC applications that are possible for other acres with sugarbeet in rotation that are growing other crops (approximately 153,376 ha [379,000 ac] annually). Additionally, other crop land without sugarbeets in rotation could also utilize PCC as a K source.
Under this scenario, the K fertilizer savings from using PCC as an alternative K source, increased from $83.77 ha-1 ($33.90 ac-1) in 2018 to $189.41 ha-1 ($76.65 ac-1) in 2022, an increase of 226% (Table 6). From 2018 to 2022, the total fertilizer K value of PCC if it was used for all acres requiring K would have ranged from $523,000 to $1,779,000 for sugarbeet, $582,000 to $1,689,000 for corn, $17,000 to $113,000 for spring malt barley, and $561,000 to $1,791,000 for potato (Russet Burbank) (Table 6).
On average, the application of PCC to meet K crop requirements, results in excess P being applied based on nutrient recommendations for all crops (ASCO, 2020; Walsh et al., 2019; Brown et al., 2020; Robertson et al., 2003; Stark et al., 2004). This paper did not account for excess P application value, however, as P is used and removed by crops over time, the excess P will have value.
4 CONCLUSIONS
The PCC produced by ASCO in the Northwest U.S. has fertilizer value and can reduce stockpile accumulations. The PCC in this study had average P and K concentrations of 12.4 kg P2O5 Mg-1 (24.8 lbs P2O5 ton-1) and 2.05 kg K2O Mg-1 (4.1 lbs K2O ton-1). The PCC is an alternative P and K source, data from this and other research studies suggests PCC P and fertilizer P likely have equivalent plant P availability. Across all crops assessed in this study (sugarbeet, corn, spring malt barley, and potato (Russet Burbank), as P and K fertilizer prices increased the value of P and K in PCC increased from $13.94 Mg-1 ($12.65 ton-1) to $28.15 Mg-1 ($25.54 ton-1), and $1.31 Mg-1 ($1.19 ton-1) to $3.16 Mg-1 ($2.87 ton-1) from 2018 and 2022. Additional agronomic value from non-nutrient uses as well as additional costs incurred in transport and application of PCC need to be accounted for to fully understand the value of PCC compared to commercial fertilizers. As costs of commercial P and K fertilizers increase, the value of PCC increases.
REFERENCES
ASCO. (2020). Sugar beet growers guide book. Amalgamated Sugar Company, LLC. Boise, ID.
Bravo S., Lee, G.S., & Schmehl, W.R. (1989). The effect of planting date, nitrogen fertilizer rate and harvest date on seasonal concentration and total content of six macronutrients in sugarbeet. Journal of Sugarbeet Research. 26,34-49.
Bresnahan, G.A., Dexter, A.G., Windels, C.E., Branter, J.R., and Luecke, J.L. (2003). The effect of spent lime on sugarbeet yield and Aphanomyces cochlioides suppression. Sugarbeet Research Extension Reports 33:273-276.
Brown, B., Hart, J., Horneck, D. & Moore, A. (2010). Nutrient management for field corn silage and grain. PNW 615, University of Idaho. Moscow, ID.
Carter, J.N. (1986). Potassium and sodium uptake effects on sucrose concentration and quality of sugarbeet roots. Journal of Sugarbeet Research. 23,184-202.
Christenson, D.R., Brimhall, P.B., Hubbell, L., and Bricker, C.E. 2000. Yield of sugar beet, soybean, corn, field bean, and wheat as affected by lime application on alkaline soils. Communications in Soil Science and Plant Analysis. 31:1145-1154.
Doxtator, C.W. & Calton. F.R. (1951). Sodium and potassium content of sugar beet varieties in some western beet growing areas. Proceedings of the 6th ASSBT Meeting. 6,144-151.
Dudley, J.W., & Powers L. (1960). Population genetics on sodium and potassium in sugar beets (Beta Vulgaris L.). Journal of Sugarbeet Research. 11,99-127.
DTN, (2022). www.dtn.com.
Hergert, G.W., Darapuneni, M.K., Aqeel, A.M., Wilson, R.G., Harveson, R.M., Bradshaw, J.D., & Nielsen, R.A. (2017). Agronomic potential of using precipitated calcium carbonate on early plant growth and soil quality in the intermountain west – greenhouse studies. Journal of Sugarbeet Research. 54,35-49.
Hlisnikovský, L.; Menšík, L.; Křížová, K.; & Kunzová, E. (2021). The Effect of Farmyard Manure and Mineral Fertilizers on Sugar Beet Beetroot and Top Yield and Soil Chemical Parameters. Agronomy. 11:133. https://doi.org/10.3390/agronomy11010133
Olson, R.A., Rhodes, M.B., & Dreier, A.F. (1954). Available phosphorus status of Nebraska soils in relation to series classification, time of sampling and method of measurement. Agronomy Journal. 46,175-180.
Robertson, L.D., & Stark, J.C. (2003). Spring barley production guide. Bul. 742. University of Idaho. Moscow, ID.
Sailsbery, S.L., & Hills, F.J. (1987). Waste lime supplies phosphorus to sugarbeet. California Agriculture. July and August ed.
Sims, A.L., Windels, C.E., & Bradley, C.A. (2010). Content and potential availability of selected nutrients in field-applied sugar beet factory lime. Communications in Soil Science and Plant Analysis. 41,438-453.
Smith, A. (2022). The story of rising fertilizer prices. https://asmith.ucdavis.edu/news/story-rising-fertilizer-prices.